The persistence of unclosed gaps in large capital structures
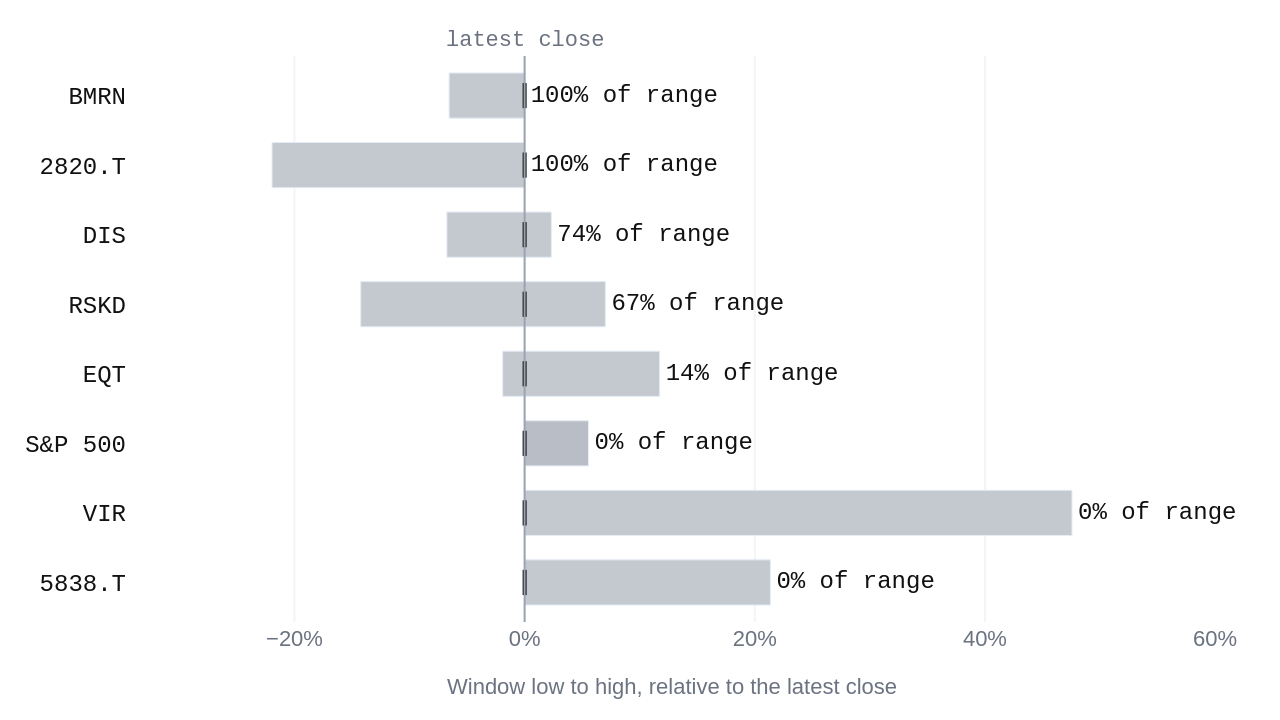
The persistence of the gap on The Walt Disney Company (DIS) for a second consecutive fortnight shows a market split between operating cash generation and narrative skepticism. When the period opened on November 11, 2026, the statistical gap sat at 2.86 standard deviations; when it closed on November 12, it rested at 2.85 standard deviations across 8 articles of negative coverage. The gap held all week, and neither side moved.
Diverging readings in domestic holdings
The first measurement is the financial reality of the business. The Walt Disney Company (DIS) carries a market value of $202.0 billion, an earnings per share figure of $5.64, a price to earnings ratio of 20.74, a dividend yield of 1.07%, and free cash flow of $10.6 billion. On its own, this measurement implies that the underlying enterprise generates cash comfortably in excess of its accounting profit, grounding its valuation in incoming funds rather than accruals.
The second measurement is the narrative dispersion and the statistical distance of 2.85 standard deviations from historical norms. On its own, this implies that prevailing written commentary prices a severe deterioration in future earnings power that has not yet appeared in the ledger. These two readings point in opposite directions. The financial statements show steady cash generation, while the pricing of the gap assumes an impairment that remains entirely hypothetical.
We do not know whether the negative coverage anticipates an invisible structural decay or whether it represents a temporary misalignment between sentiment and cash flow. The evidence cannot settle this dispute because both interpretations are compatible with the static data of a single fortnight. A cautious holder must look instead to what would confirm either view. If subsequent reporting reveals a permanent compression in segment margins or a decline in incoming cash relative to the $10.6 billion figure, the narrative side of the disagreement proves correct. If free cash flow persists alongside stable earnings per share of $5.64, the gap is merely noise in the quotation.
A similar divergence appears in EQT Corporation (EQT), where negative coverage also accompanied steady numbers. The gap there moved from 1.72 standard deviations on November 11, 2026, to 1.74 standard deviations on November 17, supported by 8 articles. The underlying business reports a market value of $31.5 billion, a price to earnings ratio of 11.85, earnings per share of $4.24, a dividend yield of 1.32%, and free cash flow of $3.8 billion. Like the larger media enterprise, the energy producer maintains cash generation well above its market price requirements while external commentary turns skeptical.
International volume and macroeconomic timing
International holdings over the same fortnight display a different pattern of price adjustment. Rakuten Bank, Ltd. (Tokyo: 5838) experienced unusually heavy selling, falling 14.9% on 4.8 times its usual volume, set against a market value of $4.9 billion, a price to earnings ratio of 9.53, earnings per share of $2.95, a dividend yield of 0.0%, free cash flow of $329.9 million, and an additional country risk premium for Japan of 0.91%. This movement occurred over the same timeframe as the broader US macroeconomic backdrop, where inflation expectations rose slightly to 2.21%, non-farm payrolls increased by 165,000 to reach 159.3 million, unemployment fell to 4.1%, real GDP grew by $203.1 billion to reach $24.6 trillion, and retail sales reached $655.3 billion. The timing is shared, but the evidence does not establish a causal transmission between domestic US economic indicators and the heavy volume in a Japanese financial institution. The international measurement points to localized selling pressure, while the US macroeconomic indicators point to continued expansion. They move in parallel only by coincidence of calendar.
Managing unclosed gaps without false certainty
Evaluating risk across these disparate holdings requires looking past ordinary threshold measures to examine the average severity of losses during periods of severe stress. When a portfolio experiences outlier days, the relevant question is not merely how often a threshold is crossed, but how deep the losses run when they occur. Coherent risk assessment rewards diversification across distinct operating models rather than treating every swing in quotation as an impairment of capital.
The evidence does not resolve whether the persistent gap on The Walt Disney Company (DIS) will close upward toward the cash flow reality or downward toward the skeptical narrative. A holder who waits for certainty will wait indefinitely. The practical response to such an unclosed gap is to monitor whether the incoming cash matches the reported $10.6 billion free cash flow, treating price swings as quotations of mood rather than verdicts on the underlying enterprise.
| Symbol | Window low vs latest | Window high vs latest | Latest in range |
|---|---|---|---|
| 2820.T | -22.0% | +0.0% | 100% |
| 5838.T | +0.0% | +21.4% | 0% |
| BMRN | -6.6% | +0.0% | 100% |
| DIS | -6.8% | +2.3% | 74% |
| EQT | -1.9% | +11.7% | 14% |
| RSKD | -14.2% | +7.0% | 67% |
| VIR | +0.0% | +47.6% | 0% |
| S&P 500 | +0.0% | +5.5% | 0% |
Questions readers ask
What happened with EQT Corporation's market gap and coverage this week?
EQT Corporation had a gap that held all week at 1.74 standard deviations, while its coverage turned negative even though the numbers held up. Its market value was measured at $31.5 billion with a free cash flow of $3.8 billion.
How much did Vir Biotechnology, Inc. drop on unusually heavy selling?
Vir Biotechnology, Inc. went down 17.8% on 8.7 times its usual volume. Its market value was measured at $1.6 billion with a free cash flow of $-141.8 million.
What were the latest figures for US real GDP and retail sales?
US real GDP reached $24.6 trillion, which was up $203.1 billion from the previous reading. Retail sales reached $655.3 billion, showing an increase of $1.4 billion from the previous reading.
What was notable about Yamami Company's volume after its long run?
Yamami Company saw extreme volume reaching 12.7 times its usual volume after a long run. Its market value was measured at $351.2 million with a price to earnings ratio of 23.74.