Coverage and operating reality diverge across horizons
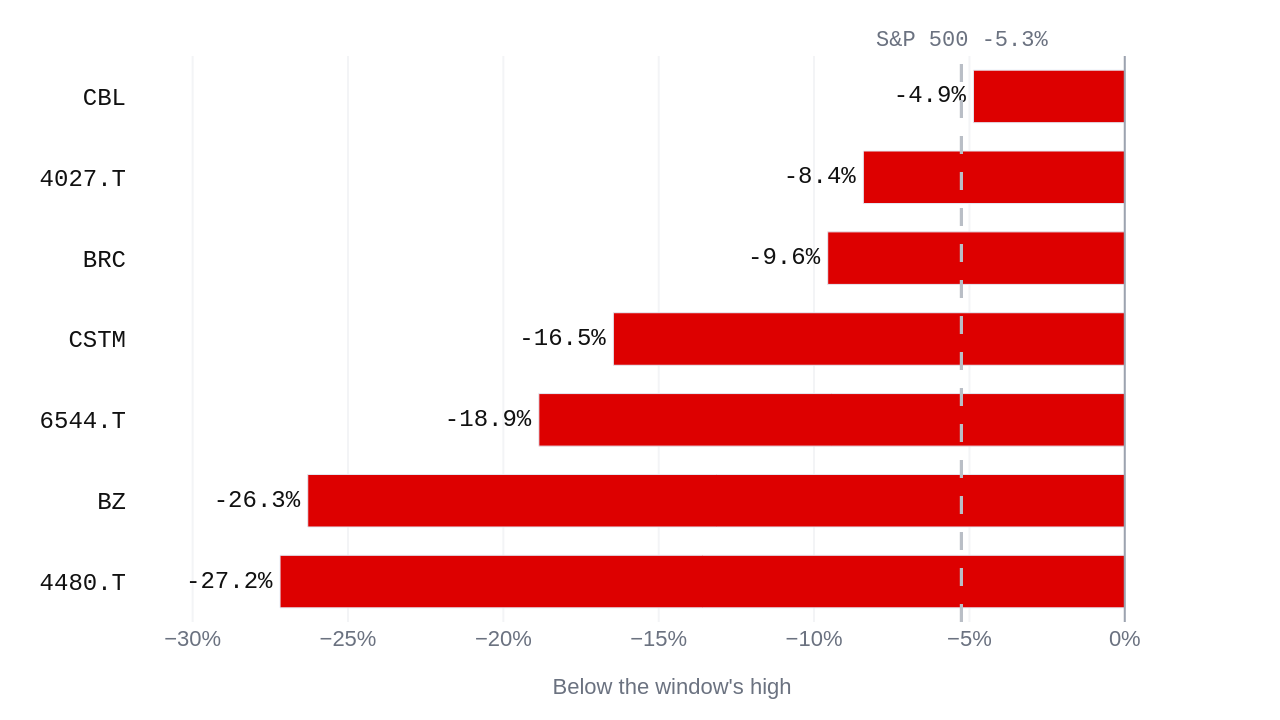
Divergence in the measurements
The divergence between negative written coverage and stable underlying financial measurements shows that short-term narrative and operating reality are pricing different horizons entirely. When companies like CBL & Associates Properties, Inc. (CBL) maintain a market value of $1.6 billion alongside a price-to-earnings ratio of 10.43 and free cash flow of $304.5 million while five articles frame the outlook negatively, the gap between sentiment and cash generation sits around 2.28 standard deviations. That gap held nearly unchanged from 2.27 standard deviations at the open of the period. Similar conditions appear in Constellium SE (CSTM) and Brady Corporation (BRC), where six articles frame each business through a negative lens while market values remain supported by earnings per share of $4.26 and $4.34 respectively. If a holder evaluates these businesses over a multi-year horizon, the pessimistic coverage describes near-term noise rather than a structural impairment of the underlying cash flows.
International volume and structural risk
Outside the United States, heavy volume events present a different test of horizon-dependent risk. Kanzhun Limited (BZ) experienced unusually heavy selling, falling 25.3% on 4.6 times its usual volume against a market value of $6.1 billion. In Japan, Medley, Inc. (Tokyo: 4480) fell 19.2% on 4.8 times its usual volume, carrying a price-to-earnings ratio of 33.28 and an additional country risk premium of 0.91%. Japan Elevator Service Holdings Co.,Ltd. (Tokyo: 6544) fell 14.3% on 7.1 times its usual volume with a price-to-earnings ratio of 28.23, while Tayca Corporation (Tokyo: 4027) experienced heavy buying, rising 21.4% on 11.5 times its usual volume despite a price-to-earnings ratio of 98.51 and a dividend yield of 3.27%. These international price movements happen against a backdrop where US economic indicators show steady output, with non-farm payrolls at 159.3 million, real GDP at $24.6 trillion, and the unemployment rate at 4.1%. A causal link between these international volume shifts and domestic US metrics cannot be established from the evidence, as they are simply simultaneous observations occurring over the same fortnight. For a holder with a multi-year view, a sudden volume-driven price shift in an international holding introduces volatility without necessarily altering the long-term earnings power of the underlying business.
Uncertainty and the limits of data
The evidence does not settle whether the negative coverage currently directed at companies like CBL, CSTM, and BRC will eventually force operational changes or simply dissipate as sentiment rotates. Social media posts claiming open gaps in GDX at specific levels are contradicted by actual closing prices of $81.64 against a recent low of $79.87, demonstrating that external commentary frequently misreads price structures. Where the evidence fails to provide certainty, a risk-cautious holder can focus on what would confirm a structural break rather than a temporary sentiment shift: a sustained deterioration in free cash flow or an unhedged rise in debt service costs would validate the negative coverage. Until those conditions appear, treating price volatility and negative articles as noise rather than permanent loss remains a defensible stance for anyone measuring their portfolio in decades rather than fortnights.
| Symbol | Below the high over 19 Oct - 17 Nov 2026 | Versus the S&P 500 |
|---|---|---|
| 4027.T | -8.4% | -3.2 pts |
| 4480.T | -27.2% | -21.9 pts |
| 6544.T | -18.9% | -13.6 pts |
| BRC | -9.6% | -4.3 pts |
| BZ | -26.3% | -21.0 pts |
| CBL | -4.9% | +0.4 pts |
| CSTM | -16.5% | -11.2 pts |
Questions readers ask
What are the key financial numbers and coverage details for CBL & Associates Properties, Inc.?
For CBL & Associates Properties, Inc., the coverage turned negative while the numbers held up. As of November 18, 2026, its market value is $1.6 billion, with a price to earnings ratio of 10.43, earnings per share of $5.05, a dividend yield of 4.14 percent, and free cash flow of $304.5 million.
Is it true that GDX has open gaps at the levels claimed by accounts on X this week?
No, accounts on X argued that GDX has open gaps at $77.50, $77.10, and $70.74, but the data contradicts this. GDX closed at $81.64 on November 13, 2026, with a recent low of $79.87, which is above all the cited gap levels, meaning there are no open gaps at those prices.
What was the latest measurement for the United States unemployment rate?
The United States unemployment rate was measured at 4.1 percent on October 1, 2026, which is down 0.1 percent from the previous reading.
What trading activity and financial figures were reported for Tayca Corporation?
Tayca Corporation experienced unusually heavy buying, going up 21.4 percent on 11.5 times its usual volume. As of November 18, 2026, its market value is $343.8 million, with a price to earnings ratio of 98.51, earnings per share of $0.15, a dividend yield of 3.27 percent, zero free cash flow, and an additional country risk premium for Japan of 0.91 percent.