Cash generation outpaces reported profit at Nvidia
Nvidia's financial measurements show that its free cash flow exceeds its net income, indicating that earnings are grounded in incoming cash rather than accounting accruals. This fortnight, market attention centers on the company's earnings debut without Jensen Huang as chief executive, with www.cnbc.com reporting that analysts are questioning who and what comes next while observing that the firm remains at the center of artificial intelligence. For a cautious holder, the central question is whether cash conversion supports the structural moat despite executive changes.
Evaluating cash conversion and earnings
The cash surplus mechanism. When free cash flow outpaces net income over a multi-year period, fundamental analysis treats it as a durable signal that profits are backed by actual liquidity rather than deferred recognition. Nvidia recorded a net income of $120.1 billion against a free cash flow figure of $148.7 billion for fiscal year 2026, demonstrating that incoming cash exceeds accounting earnings. This relationship contrasts with the usual warning pattern where profit accumulates without matching cash flows.
The valuation arithmetic. The price to earnings ratio of 16.63 is derived by dividing the market value of $3.7 trillion by total earnings, where earnings per share stands at $9.39. This multiple prices the business against cash generation that yields $148.7 billion in free cash flow, indicating that the market attaches a modest valuation to each dollar of actual liquidity produced by the firm.
Assessing structural resilience and risk
The capital efficiency mechanism. Independent analysis reports a return on invested capital of 62.9% and an operating return on assets of 81.9%, showing that deployed capital generates returns significantly above its cost. Accounts on X argued this week that Nvidia's chips undermined the durable model moat assumption for United States artificial intelligence investments, but these financial returns contradict that concern by demonstrating high operational efficiency. The market already believes that the departure of the founder removes the singular force behind these returns, pricing the shares as though executive presence was the primary asset. If that belief is wrong, the business continues to convert revenue into cash through established client dependencies, supported by revenue growing from $130.5 billion to $215.9 billion.
The cost of being wrong runs unevenly across these positions. The situation is whether executive departure compromises structural execution while cash conversion remains high. If the optimistic reading is wrong and executive departure fractures product delivery, a holder faces a contraction in valuation multiples from current levels. If the cautious reading is wrong and the business operates effectively without its founder, a holder who reduces exposure foregoes participation in cash generation that yields $148.7 billion in free cash flow against a $3.7 trillion market value. These two costs are not equal: the permanent impairment of holding a declining asset is larger than the opportunity cost of missing cash generation, tilting the asymmetry toward caution. This asymmetry narrows if capital expenditure by major buyers slows, and widens if operating return on assets remains at 81.9%.
The strongest case against this view holds that artificial intelligence infrastructure spending is cyclical and concentrated among a small number of buyers whose own capital constraints will eventually limit Nvidia's sales. Under this argument, the high return on invested capital is a temporary peak driven by a temporary shortage of computing components rather than a permanent structural moat, making current earnings an unreliable guide to future cash flows. www.cnbc.com noted that analysts question who and what comes next, reflecting broader uncertainty about whether future demand can sustain the top-line growth that took revenue from $130.5 billion to $215.9 billion.
The conclusion changes if quarterly revenue growth departs from the trajectory established across recent periods. A holder should watch subsequent reports for any quarter where free cash flow falls below net income, as that divergence would signal that accounting accruals have begun to outpace incoming cash.
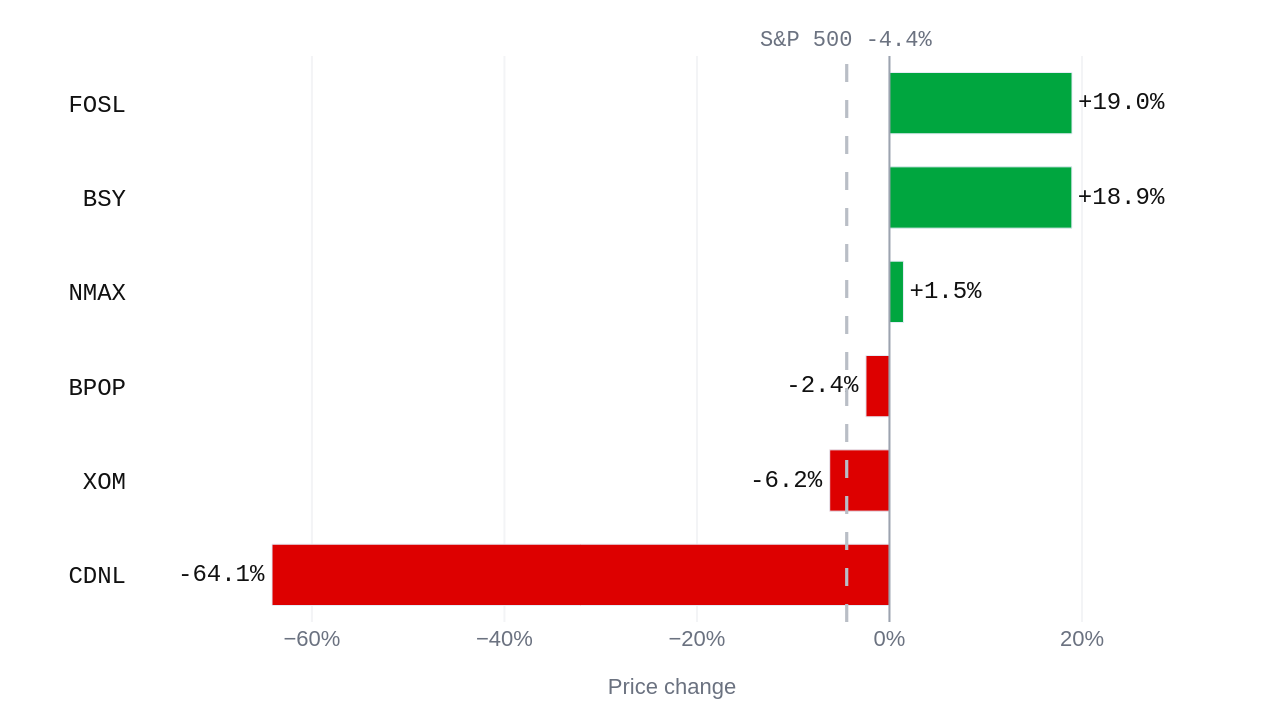
| Symbol | Change over 19 Oct - 17 Nov 2026 | Versus the S&P 500 |
|---|---|---|
| BPOP | -2.4% | +2.0 pts |
| BSY | +18.9% | +23.4 pts |
| CDNL | -64.1% | -59.7 pts |
| FOSL | +19.0% | +23.4 pts |
| NMAX | +1.5% | +5.9 pts |
| XOM | -6.2% | -1.8 pts |
Questions readers ask
What was the recent reading for the US unemployment rate?
The unemployment rate was 4.1% as of October 1, 2026, down 0.1% from the previous reading, while non-farm payrolls reached 159.3 million.
What were the financial numbers for Popular, Inc. (BPOP) when coverage turned negative?
Popular, Inc. (BPOP) had a market value of $9.6 billion and a free cash flow of $884.7 million as of November 18, 2026, while its coverage turned negative and its numbers held up.
What was the trading volume and price change for Fossil Group, Inc. (FOSL)?
Fossil Group, Inc. (FOSL) experienced unusually heavy buying with the price up 26.7% on 9.1× its usual volume, and a market value of $480.2 million as of November 18, 2026.
How did thermal power generation change in China in October 2026?
Thermal power, which is primarily coal, fell 7.3% y/y in October 2026 for its fourth straight monthly decline, while solar power was up 31% and wind power was up 34%.