Prices discount expected earnings before business cycles turn
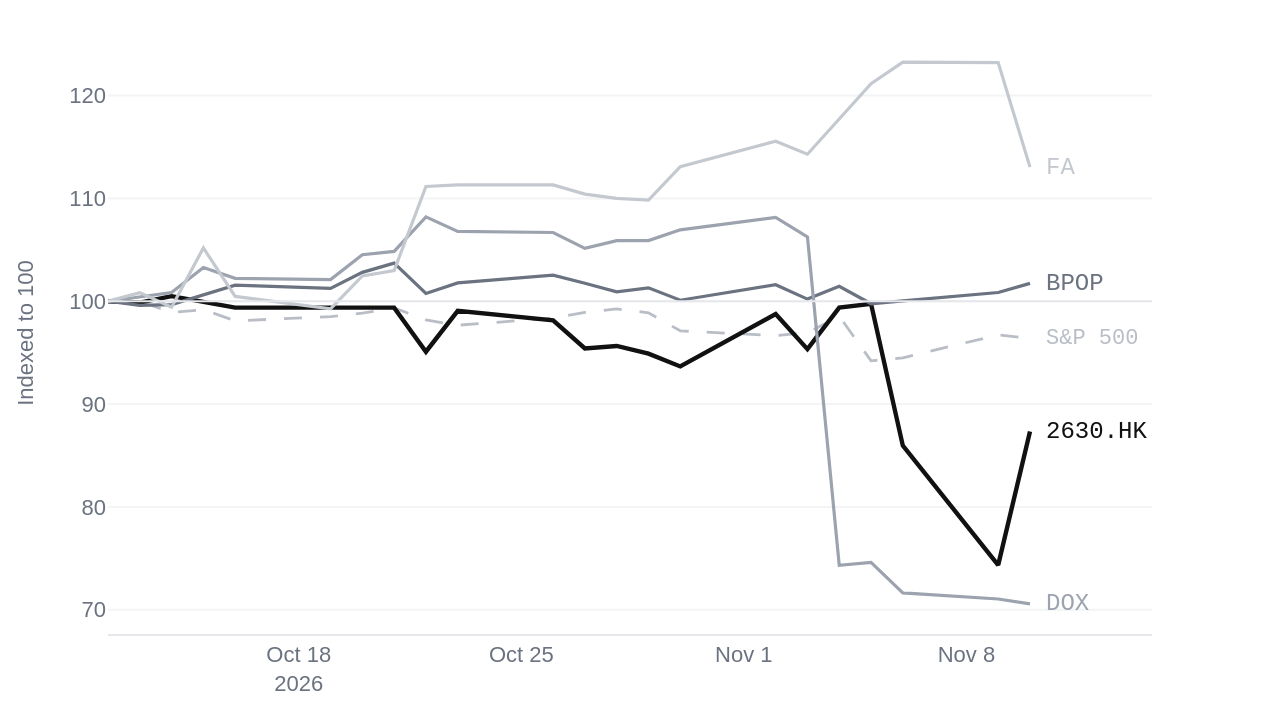
The persistent gap on Popular Inc
This is the second issue running in which the same disagreement has appeared across the market. The market has now had a full period to close the gap on Popular, Inc. (BPOP) and has not. When the period opened on November 4, 2026, the gap stood at 1.83 standard deviations, and it remained at 1.83 standard deviations when the period closed. Behind this reading sit nine articles discussing Popular, Inc. (BPOP), with coverage turning negative while the numbers held up. Popular, Inc. (BPOP) carries a market value of $10.0 billion, a price to earnings ratio of 10.02, earnings per share of $16.23, a dividend yield of 1.98%, and free cash flow of $666.1 million.
A similar pattern appears in General Motors Company (GM) and First Advantage Corporation (FA). For General Motors Company (GM), the gap was 1.74 standard deviations when the period opened on November 5, 2026, and stayed at 1.74 standard deviations when it closed, supported by nine articles. General Motors Company (GM) holds a market value of $75.3 billion, a price to earnings ratio of 20.07, earnings per share of $4.50, a dividend yield of 0.78%, and free cash flow of $16.5 billion. First Advantage Corporation (FA) shows a gap of 1.74 standard deviations when the period opened on November 5, 2026, and closed at 1.74 standard deviations, backed by six articles. First Advantage Corporation (FA) has a market value of $3.7 billion, a price to earnings ratio of 85.47, earnings per share of $0.25, a dividend yield of 0.0%, and free cash flow of $205.3 million. In all three cases, written coverage turned negative while numerical fundamentals remained intact.
Conflicting signals in the broader economy
Macroeconomic indicators continue to present diverging pictures. Real gross domestic product reached $24.6 trillion as of July 1, 2026, rising by $203.1 billion from the previous reading. Non-farm payrolls reached 159.3 million as of October 1, 2026, increasing by 165,000, while the unemployment rate fell to 4.1%. Against this growth, consumer sentiment fell to 48.1 as of September 1, 2026, dropping 3.6 points from the prior reading. The federal funds rate stands at 3.88% as of October 1, 2026, up 0.13%, and inflation expectations moved to 2.2% as of November 10, 2026, down 0.02%.
Commentary on energy markets also required correction against underlying data. While accounts on X argued that oil prices dropped below $85 per barrel for the first time since August 31 following suggestions that additional strikes on Iran were unnecessary, actual trading data shows West Texas Intermediate trading at $68.40 as of November 10, 2026, having remained below $85 consistently since early September. However, claims that oil prices fell 19% since the October 30 high are supported by the record: prices peaked at $84.50 on October 30 and declined to $68.40, marking a drop of 19.05%. Equity markets have historically fallen before recessions began and turned up before they ended because prices discount expected earnings, meaning that bad economic news arriving alongside resilient financial metrics reflects the normal pattern near a turning point rather than a contradiction.
Evaluating price and narrative divergence
To examine whether a security's market price reflects underlying financial reality or prevailing narrative, one can apply a structured method. This approach answers the question of whether a valuation gap stems from fundamental deterioration or temporary sentiment shifts. It measures the statistical distance between financial output and published commentary while deliberately ignoring media tone and short-term price velocity.
Applying this to Popular, Inc. (BPOP), the method weighs $666.1 million in free cash flow and a price to earnings ratio of 10.02 against a stubborn 1.83 standard deviation gap and nine critical articles. A reader would know this method is unsuited to a specific situation if the financial fundamentals themselves begin deteriorating in exact alignment with the negative coverage, which would render the statistical gap between price and output meaningless rather than informative.
Weighing competing interpretations of persistence
The persistence of the gap in Popular, Inc. (BPOP) presents an unresolved disagreement between two interpretations. On one hand, the financial metrics imply that the market is mispricing a company generating $16.23 in earnings per share and $666.1 million in free cash flow solely due to adverse written commentary. On the other hand, the persistence of the 1.83 standard deviation gap across the fortnight implies that market participants are discounting risks not captured in trailing earnings figures.
These two interpretations point in opposite directions. The case for the first is that historical cash generation has reliably rewarded patient holders. The case for the second is that written coverage often anticipates structural impairments before they appear in accounting reports. This letter does not resolve which interpretation is correct. Settling the question would require observing whether subsequent earnings reports confirm the stability of free cash flow or validate the concerns raised in the nine articles.
Volume extremes across domestic and international assets
Other securities experienced notable volume shifts during the fortnight. Veracyte, Inc. (VCYT) experienced unusually heavy selling, falling 54.3% on 12.8 times its usual volume, backed by a market value of $1.9 billion, a price to earnings ratio of 15.13, earnings per share of $1.58, and free cash flow of $161.4 million. LendingTree, Inc. (TREE) saw unusually heavy buying, rising 32.8% on 5.1 times its usual volume, with a market value of $496.3 million, a price to earnings ratio of 4.82, earnings per share of $7.06, and free cash flow of $81.1 million.
Amdocs Limited (DOX) showed extreme volume at 9.4 times its usual volume after a long run, indicating possible exhaustion, alongside a market value of $4.5 billion, a price to earnings ratio of 8.86, earnings per share of $4.83, a dividend yield of 5.39%, and free cash flow of $562.2 million. In international markets, Vigonvita Life Sciences Co., Ltd. (Hong Kong: 2630) registered extreme volume at 8.7 times its usual volume after a long run, pointing toward possible exhaustion, with a market value of $1.6 billion and an additional country risk premium for Hong Kong of 0.78%. These international volume figures move alongside domestic measurements over the same fortnight without implying a direct transmission mechanism between them. Markets price the future through the friction of conflicting evidence, and where numbers and narratives diverge, patience remains the primary instrument of measurement.
| Symbol | Change over 4-10 Nov 2026 | Versus the S&P 500 |
|---|---|---|
| 2630.HK | -12.7% | -9.0 pts |
| BPOP | +1.7% | +5.4 pts |
| DOX | -29.4% | -25.8 pts |
| FA | +13.0% | +16.7 pts |
Questions readers ask
What is the current trading price of oil and how much has it dropped from its recent high?
WTI is trading at $68.40 as of 2026-11-10. This is a drop of 19.05% from the peak of $84.50 on Oct 30.
What are the latest measurements for real GDP and the unemployment rate in the US economy?
Real GDP reached $24.6 trillion as measured on 2026-07-01, up $203.1 billion from the previous reading. The unemployment rate was 4.1% as measured on 2026-10-01, down 0.1% from the previous reading.
Which company experienced unusually heavy selling and what are its key figures?
Veracyte, Inc. (VCYT) had unusually heavy selling, down 54.3% on 12.8 times its usual volume. Its market value is $1.9 billion as measured on 2026-11-11, with earnings per share of $1.58.
Which companies are new this week with coverage turning negative while their numbers held up?
General Motors Company (GM), Popular, Inc. (BPOP), and First Advantage Corporation (FA) are new this week with coverage turning negative while their numbers held up. General Motors Company (GM) and First Advantage Corporation (FA) are both 1.7 std devs apart, while Popular, Inc. (BPOP) is 1.8 std devs apart.