What sentiment surveys miss about the cash underneath
The word sentiment is generally taken by markets as a reliable thermometer for upcoming economic behavior, acting as a proxy for how willing households and businesses are to deploy capital. Underneath that common usage, however, sentiment measures something much narrower: the self-reported answers given on a questionnaire at a specific point in time, recording how respondents describe their current financial comfort rather than what transactions they are executing on their ledgers. When these two definitions are treated as identical, investors risk mistaking a change in mood for a change in solvency. The recent period illustrates this split directly. Consumer sentiment fell 3.6 to 48.1, yet real GDP rose $203.1 billion to reach $24.6 trillion. People expressed greater pessimism on surveys while national output expanded, demonstrating that reported mood and actual economic output can move in opposite directions without altering the underlying cash flows of a solvent business.
Measuring the gap between public coverage and financial reality
Building on the discussions of public coverage divergence examined in issue sixteen, this period offers several distinct examples where the narrative described in articles and the numbers reported in financial statements point to entirely different conclusions. In the case of COMPASS Pathways plc, market value stands at $1.2 billion while free cash flow sits at $-176.8 million, with earnings per share at $-1.92 and a price to earnings ratio of -2.05 and a dividend yield of 0.0%. Throughout the period from October twenty-eighth to November third, the gap between its public coverage and its financial numbers held steady, opening at -1.94 standard deviations apart on October thirtieth, reaching its widest point at -1.99 standard deviations on November second, and closing at -1.44 standard deviations on November third across 7 articles. The coverage stayed upbeat while the numbers softened, showing that risk can build quietly while the story still reads well. If this condition holds, holders of the security are exposed to a sudden reconciliation whenever the public narrative eventually aligns with the cash burn, though the evidence from the period does not settle when that adjustment will occur.
Divergences where coverage turns negative while numbers hold
Conversely, Extreme Networks, Inc. presents the opposite pattern where public coverage turned negative while the underlying numbers held up. The company carries a market value of $3.0 billion, earnings per share of $0.40, a price to earnings ratio of 57.24, a dividend yield of 0.0%, and free cash flow of $120.5 million. The gap between its coverage and its financial metrics opened the period at 1.85 standard deviations apart on October thirtieth and closed at 1.78 standard deviations apart on November third across 6 articles, holding all week without either side moving. Star Bulk Carriers Corp. exhibits a similar configuration, with a market value of $3.1 billion, earnings per share of $2.58, a price to earnings ratio of 10.66, a dividend yield of 6.89%, and free cash flow of $286.1 million. Its gap opened at 2.45 standard deviations apart on October twenty-ninth and closed at 2.40 standard deviations apart on October thirtieth across 4 articles. In both instances, the public narrative turned negative while the financials remained stable. As noted in the Federal Reserve Board statement on the federal funds rate at 3.88% and inflation expectations easing to 2.3%, broader monetary conditions frame these asset-level discrepancies without dictating their resolution.
Understanding heavy volume through what buyers and sellers are doing
When large blocks of shares change hands at multiples of normal daily activity, the underlying mechanism is often described through technical formulas, but for a portfolio holder the relevant question is simply who is being forced or persuaded to transact. Crocs, Inc. experienced unusually heavy buying, rising 25.5% on 4.7 times its usual volume, backed by a market value of $7.0 billion, earnings per share of $14.01, a price to earnings ratio of 11.37, a dividend yield of 0.0%, and free cash flow of $754.0 million. Glaukos Corporation likewise saw heavy buying, rising 33.6% on 5.0 times its usual volume, with a market value of $13.8 billion, earnings per share of $-2.87, a price to earnings ratio of -79.27, a dividend yield of 0.0%, and free cash flow of $36.0 million. In these instances, capital moved aggressively toward companies generating positive free cash flow or expanding operating margins, reflecting institutional buyers positioning ahead of earnings releases rather than reacting to survey data.
Where heavy selling alters the picture
On the other side of the ledger, heavy selling occurred where cash flows or earnings profiles failed to satisfy institutional participants. F5, Inc. experienced unusually heavy selling, falling 20.4% on 6.1 times its usual volume, supported by a market value of $18.8 billion, earnings per share of $12.72, a price to earnings ratio of 26.12, a dividend yield of 0.0%, and free cash flow of $868.9 million. Iovance Biotherapeutics, Inc. saw heavy selling as well, falling 35.4% on 5.1 times its usual volume, with a market value of $4.0 billion, earnings per share of $-0.64, a price to earnings ratio of -12.10, a dividend yield of 0.0%, and free cash flow of $-296.4 million. As the Bank for International Settlements noted in its assessment of monetary policy, and as Federal Reserve Governor Waller discussed in his speech on the economic outlook, institutional positioning shifts when capital costs rise. The precise reading of volume and financial statements tells us where large participants are exiting or entering positions, but it still does not tell us whether the current price fully discounts the future path of interest rates or inflation expectations.
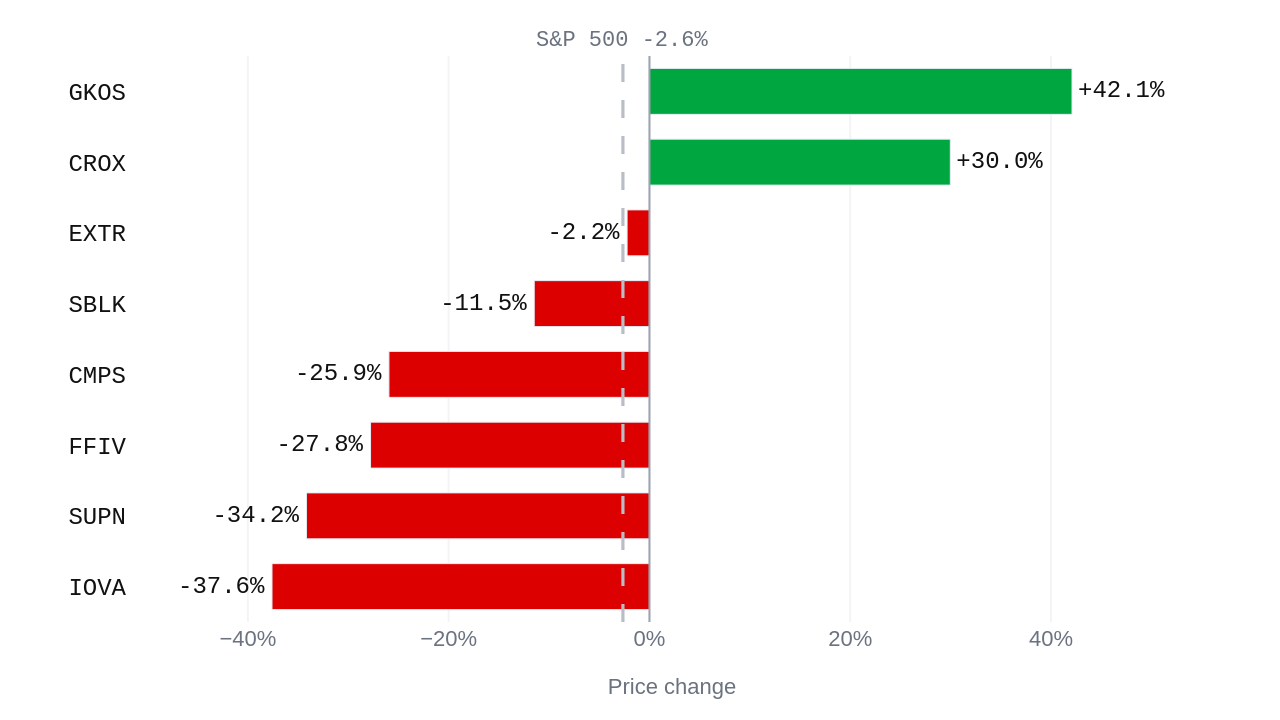
| Symbol | Change over 5 Oct - 3 Nov 2026 | Versus the S&P 500 |
|---|---|---|
| CMPS | -25.9% | -23.3 pts |
| CROX | +30.0% | +32.6 pts |
| EXTR | -2.2% | +0.4 pts |
| FFIV | -27.8% | -25.1 pts |
| GKOS | +42.1% | +44.7 pts |
| IOVA | -37.6% | -35.0 pts |
| SBLK | -11.5% | -8.8 pts |
| SUPN | -34.2% | -31.5 pts |
Questions readers ask
How much did the real GDP of the US economy change?
The real GDP of the US economy reached $24.6 trillion when measured on 2026-07-01, which is an increase of $203.1 billion from the previous reading.
How did Crocs, Inc. perform during the heavy buying?
Crocs, Inc., with the symbol CROX, saw unusually heavy buying as it went up 25.5% on 4.7 times its usual volume, backed by a market value of $7.0 billion and earnings per share of $14.01.
What was the closing gap for COMPASS Pathways plc?
For COMPASS Pathways plc, using the symbol CMPS, the gap when it closed was -1.44 standard deviations on 2026-11-03. Its market value was measured at $1.2 billion with free cash flow of $-176.8 million.
What is the dividend yield for Star Bulk Carriers Corp.?
Star Bulk Carriers Corp., using the symbol SBLK, has a dividend yield of 6.89% as measured on 2026-11-04. It has a market value of $3.1 billion and free cash flow of $286.1 million.