Healthcare valuations mask a widening gap between sentiment and cash
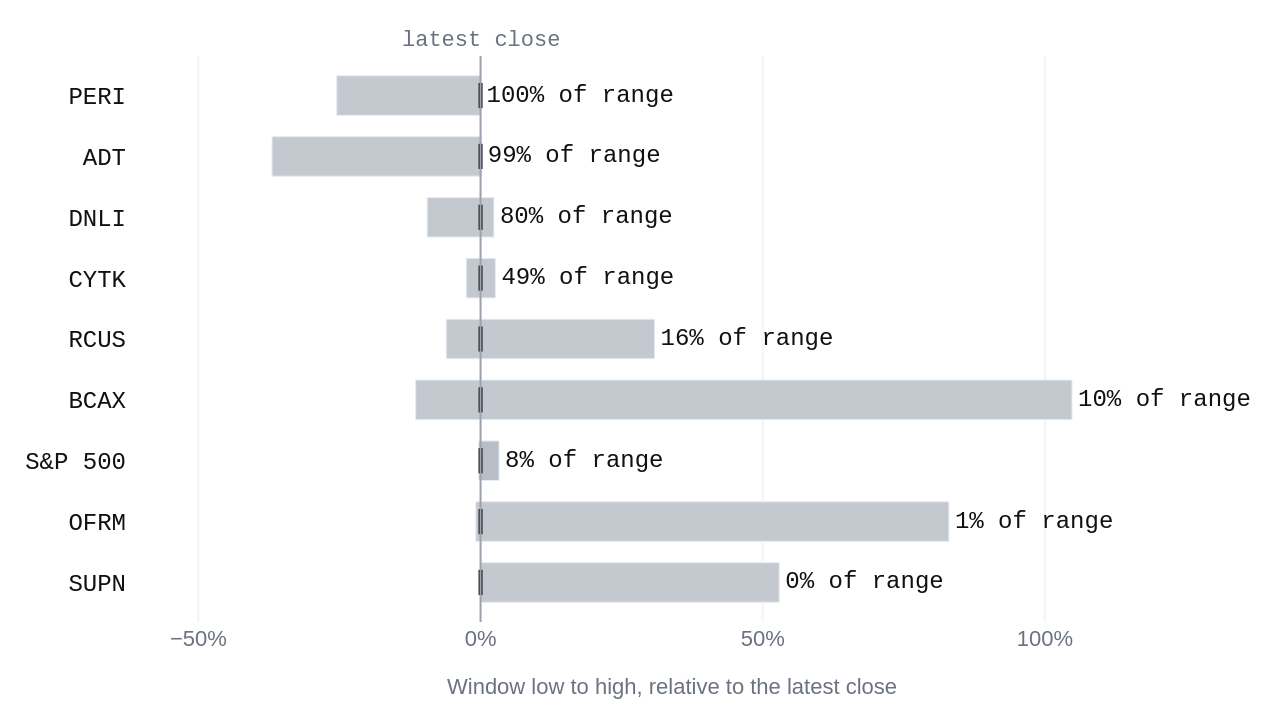
The market is currently mispricing the healthcare sector by evaluating clinical-stage companies through standard equity return models while ignoring the structural cash burn that dictates their survival. Four of the seven monitored subjects sit in this sector, and each exhibits a stark divergence between published commentary and underlying financial reality. Risk accumulates quietly when optimism persists despite deteriorating cash metrics.
The valuation disconnect.
Evaluating these businesses requires examining the arithmetic linking their market valuations to their per-share losses. Taking Cytokinetics with a market value of $8.7 billion and negative earnings per share of $-6.77 yields a price-to-earnings ratio of -8.64. Similar structural arithmetic applies across the group, where Arcus Biosciences trades at a market value of $2.4 billion with earnings per share of $-3.58 resulting in a price-to-earnings ratio of -4.81, and Denali Therapeutics carries a market value of $3.1 billion alongside earnings per share of $-1.67 to produce a price-to-earnings ratio of -11.24. Standard equity models treat these negative multiples as temporary operational setbacks rather than structural liabilities, missing the fundamental exposure these firms have to ongoing capital market access.
The narrative persistence.
The coverage surrounding these clinical enterprises has remained remarkably upbeat even as their underlying numbers soften. For Cytokinetics, eight articles supported the latest reading while the pricing gap stood between -1.94 and -1.98 standard deviations apart throughout the period. Arcus Biosciences saw five articles maintain a positive tone while its valuation gap held between -2.38 and -2.46 standard deviations. Denali Therapeutics demonstrated an even sharper divergence, with five articles supporting the narrative while its gap widened from -0.99 to -1.98 standard deviations. When commentary remains detached from financial deterioration, holders face an environment where price adjustments happen abruptly rather than gradually.
The liquidity shock.
External financial conditions compound this structural vulnerability. With the federal funds rate at 3.88%, up 0.13% from the previous reading, and consumer sentiment resting at 48.1 after falling 3.6 points, the cost of capital is distinctly different from the zero-rate regime that funded early-stage clinical development for years. Bicara Therapeutics illustrated the market's intolerance for cash consumption when it experienced unusually heavy selling, dropping 44.2% on 18.2 times its usual volume against a market value of $592.9 million, negative earnings per share of $-2.73, and negative free cash flow of $-135.2 million. When funding conditions tighten, companies carrying negative free cash flow—such as Cytokinetics at $-580.7 million, Arcus Biosciences at $-475.0 million, and Denali Therapeutics at $-450.0 million—face a binary test that standard risk models fail to capture.
An advocate for the optimistic reading would argue that clinical-stage biotechnology companies are mispriced precisely because traditional financial ratios cannot capture future pipeline value or potential licensing partnerships. In this view, negative free cash flows and negative earnings per-share figures are expected investments in intellectual property rather than signs of distress, and the widening gaps between sentiment and historical pricing metrics merely represent temporary market inefficiencies that precede clinical breakthroughs. Furthermore, with inflation expectations easing slightly to 2.3% and real GDP rising $203.1 billion to reach $24.6 trillion, the broader macroeconomic foundation remains stable enough to support risk-taking in high-potential sectors. Yet this perspective relies on assuming that future milestone value will always materialize before existing capital reserves are exhausted, an assumption that ignores the hard arithmetic of burn rates when external financing windows narrow.
The structural risk facing a holder who maintains these positions without accounting for cash runway is asymmetric. If the optimistic reading is correct and clinical developments succeed, the upside is bounded by current market valuations and future dilution. If the cautious reading is correct and financing conditions force dilutive capital raises or pipeline curtailments, the downside involves severe permanent capital impairment. This asymmetry is made wider by higher federal funds rates and narrower only if incoming clinical data accelerates faster than cash burn depletes reserves. A holder should watch the trajectory of free cash flow disclosures alongside circulating article counts; if coverage continues to detach from negative cash flows while financing costs edge upward, the conclusion shifts from temporary mispricing to structural distress.
| Symbol | Window low vs latest | Window high vs latest | Latest in range |
|---|---|---|---|
| ADT | -37.0% | +0.2% | 99% |
| BCAX | -11.5% | +104.8% | 10% |
| CYTK | -2.5% | +2.6% | 49% |
| DNLI | -9.5% | +2.4% | 80% |
| OFRM | -0.8% | +83.0% | 1% |
| PERI | -25.5% | +0.0% | 100% |
| RCUS | -6.1% | +30.8% | 16% |
| SUPN | +0.0% | +52.9% | 0% |
| S&P 500 | -0.3% | +3.3% | 8% |
Questions readers ask
What is the latest reading for the US real GDP?
The real GDP was measured at $24.6 trillion on July 1, 2026, which is up $203.1 billion from the previous reading, showing the total economic output for that period.
How did the gap change for Denali Therapeutics Inc. over the week?
For Denali Therapeutics Inc., the gap when the period opened was -0.99 std devs on October 30, 2026, and it closed at -1.98 std devs on November 3, 2026, meaning the gap widened over the week as the coverage moved further from the numbers with 5 articles behind the latest reading.
What were the market details for ADT Inc.?
ADT Inc. showed unusually heavy buying with the stock up 33.2% on 22.2× its usual volume, featuring a market value of $6.7 billion and a free cash flow of $1.8 billion measured on November 4, 2026.
What was the consumer sentiment in the US economy?
US consumer sentiment was measured at 48.1 on September 1, 2026, which is down 3.6 from the previous reading, reflecting how consumers viewed economic conditions at that time.