Coverage and corporate numbers diverge when economic signals point in opposite directions
Reconciling conflicting signals across the market
Coverage and the numbers are currently agreeing on very little, as falling consumer sentiment and rising gross domestic product pull macroeconomic narrative and underlying financial metrics in opposite directions. To navigate this split, an investor needs a method that answers a specific question: how can one determine whether a negative shift in public coverage represents a genuine operational deterioration or merely a temporary narrative divergence from financial reality? This method measures the mathematical distance between reported earnings performance and prevailing media tone, while deliberately ignoring daily price volatility and headline urgency. Consider TE Connectivity plc (TEL) as a worked example. During this period, coverage turned negative while the numbers held up, leaving a gap of 2.45 standard deviations when the period opened on 2026-10-29, closing at 2.40 standard deviations by 2026-11-02 across 4 articles. Yet the company maintains a market value of $63.6 billion, a price-to-earnings ratio of 19.73, earnings per share of $11.14, a dividend yield of 1.36%, and free cash flow of $3.7 billion. Similar gaps appeared in Popular, Inc. (BPOP), where coverage turned negative while numbers held up, widening from 1.71 standard deviations to 1.78 standard deviations across 9 articles, supported by a market value of $9.9 billion, a price-to-earnings ratio of 9.87, earnings per share of $16.23, a dividend yield of 2.01%, and free cash flow of $666.1 million. Nasdaq, Inc. (NDAQ) exhibited the same pattern, holding a gap between 2.35 and 2.32 standard deviations across 4 articles, backed by a market value of $59.8 billion, a price-to-earnings ratio of 28.91, earnings per share of $3.73, a dividend yield of 1.08%, and free cash flow of $2.3 billion. A reader would know this method is unsuited to a situation if narrative tone and fundamental numbers move in absolute lockstep, or if underlying cash flows begin contracting at the exact rate that coverage turns pessimistic.
Weighing consumer sentiment against economic output
Consumer sentiment fell 3.6 points to 48.1, which implies that households perceive a deteriorating economic environment and are restricting their willingness to deploy capital. Conversely, real gross domestic product rose $203.1 billion to reach $24.6 trillion, which implies that overall economic output and productive capacity continue to expand. These two primary economic indicators point in entirely different directions. The case for sentiment being the more reliable signal rests on the idea that consumer hesitation precedes spending cuts, acting as an early indicator for upcoming economic behavior. The case for gross domestic product being the more reliable signal rests on the reality that aggregate output measures actual transactions and earned income rather than reported attitudes. We are not resolving which signal holds greater weight here. What would settle the dispute is sustained data showing whether the contraction in consumer sentiment eventually translates into a contraction in output, or whether expanding GDP absorbs household hesitation. In light of the principle that equity markets usually fall before recessions begin and turn up before they ended because prices discount expected earnings, bad economic news arriving alongside rising output is a normal pattern near a turn rather than a contradiction.
Examining unusual volume and price shifts
ServiceNow, Inc. (NOW) experienced unusually heavy selling, falling 26.9% on 6.1 times its usual volume, alongside a market value of $113.3 billion, a price-to-earnings ratio of 77.97, earnings per share of $1.40, zero dividend yield, and free cash flow of $4.8 billion. Alnylam Pharmaceuticals, Inc. (ALNY) saw unusually heavy selling as well, dropping 25.1% on 8.4 times its usual volume, with a market value of $21.4 billion, a price-to-earnings ratio of 7.85, earnings per share of $20.36, zero dividend yield, and free cash flow of $500.7 million. Stevanato Group S.p.A. (STVN) experienced heavy selling too, down 28.6% on 12.2 times its usual volume, with a market value of $3.9 billion, a price-to-earnings ratio of 26.13, earnings per share of $0.55, a dividend yield of 0.44%, and negative free cash flow of $28.8 million. Conversely, Hyperliquid Strategies Inc Common Stock (PURR) showed unusually heavy buying, rising 23.3% on 5.1 times its usual volume, with a market value of $1.4 billion, a price-to-earnings ratio of 15.62, earnings per share of $1.58, zero dividend yield, and negative free cash flow of $19.1 million. These sharp price dislocations occurred alongside federal funds rate positioning at 3.88%, up 0.13%, and inflation expectations edging up 0.01% to 2.3%. Where the evidence cannot settle whether these sharp moves represent fundamental re-pricing or temporary sentiment swings, a portfolio holder must look to the underlying cash flows and capital generation rather than the magnitude of Loser-take-all price shifts.
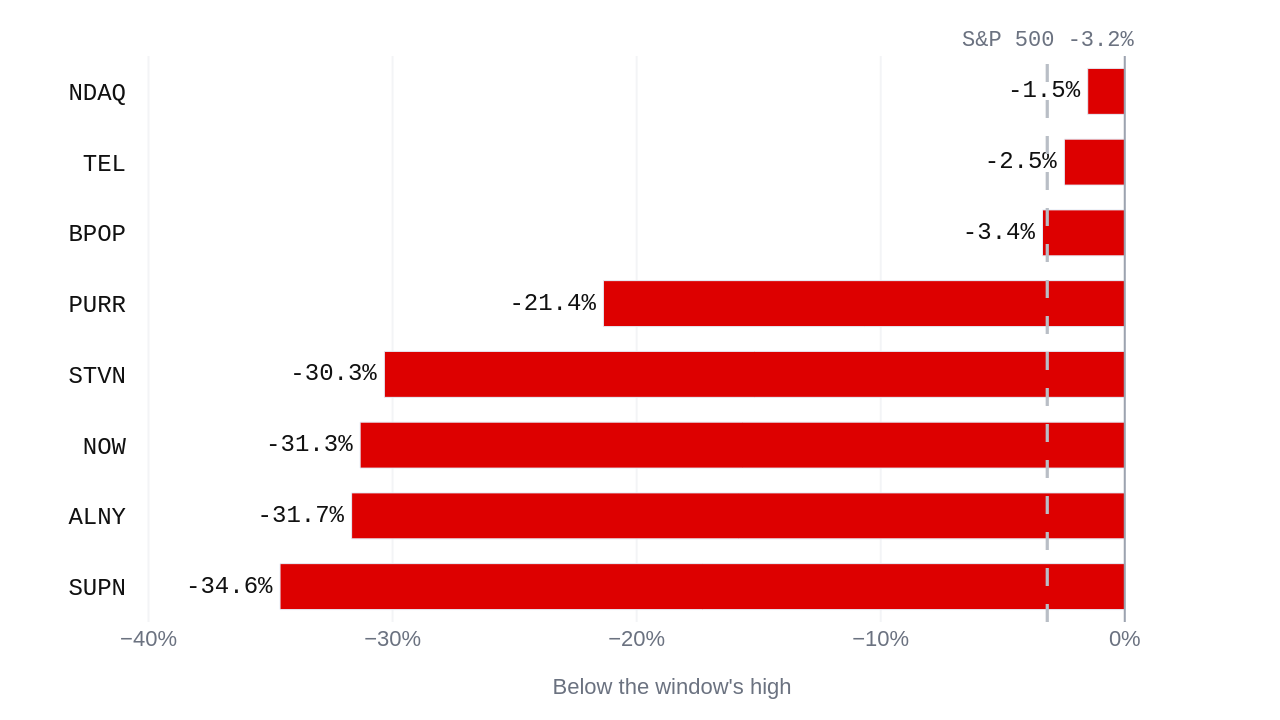
| Symbol | Below the high over 5 Oct - 3 Nov 2026 | Versus the S&P 500 |
|---|---|---|
| ALNY | -31.7% | -28.5 pts |
| BPOP | -3.4% | -0.2 pts |
| NDAQ | -1.5% | +1.7 pts |
| NOW | -31.3% | -28.2 pts |
| PURR | -21.4% | -18.2 pts |
| STVN | -30.3% | -27.2 pts |
| SUPN | -34.6% | -31.4 pts |
| TEL | -2.5% | +0.7 pts |
Questions readers ask
How much did real GDP change in the latest reading?
Real GDP was $24.6 trillion, which was up by $203.1 billion from the previous reading.
What was the gap for TE Connectivity plc when the period opened?
The gap for TE Connectivity plc when the period opened was 2.45 std devs on October 29, 2026, and it closed at 2.40 std devs on November 2, 2026, with 4 articles behind the latest reading.
How heavy was the selling for ServiceNow, Inc.?
ServiceNow, Inc. saw unusually heavy selling, going down 26.9% on 6.1× its usual volume, with a market value of $113.3 billion and free cash flow of $4.8 billion.
How wide did the gap get for Popular, Inc.?
The widest the gap got for Popular, Inc. was 1.78 std devs on November 2, 2026, backed by 9 articles behind the latest reading.