When public commentary and operating numbers part ways
The gap between what is written about a company and what its ledgers show is rarely wider than it is during periods of macroeconomic friction. When consumer sentiment fell 3.6 to 48.1 while non-farm payrolls rose 29,000 to 159.0 million, unemployment ticked up to 4.2%, and retail sales grew by $4.7 billion to $652.1 billion, public commentary attempted a synthesis that the underlying numbers resisted. Taken together, these disagreements show that public coverage and financial performance are currently agreeing on very little. For a portfolio owner holding established US equities alongside international exposure, understanding this divergence requires looking past the narrative and examining where valuations sit relative to their operating reality.
Words and ledgers in established firms
Consider three distinct holdings where public coverage turned negative while the operating numbers held steady throughout the week. At Bank of Hawaii Corporation (BOH), valued at $2.8 billion with a price-to-earnings ratio of 12.29, earnings per share of $6.27, a dividend yield of 4.0%, and free cash flow of $302.1 million, the gap between sentiment and financials opened the period at 2.33 standard deviations and closed it at 2.27 standard deviations across 4 articles. The gap held all week without movement on either side. A similar pattern appeared at Amer Sports, Inc. (AS), carrying a market value of $16.4 billion, a price-to-earnings ratio of 29.06, earnings per share of $0.94, zero dividend yield, and $686.0 million in free cash flow. Its gap began at 1.79 standard deviations and closed at 1.75 standard deviations across 7 articles. Brady Corporation (BRC), valued at $3.9 billion with a price-to-earnings ratio of 19.07, earnings per share of $4.34, a dividend yield of 1.19%, and free cash flow of $192.7 million, mirrored this exact structure, opening at 1.79 standard deviations and closing at 1.75 standard deviations across 5 articles. In each case, the distance between how these businesses were described in print and what their cash generation demonstrated remained elevated. These statistical gaps sit near the upper bound of their historical distribution for these names. Historically, a gap of this width coincides with periods where external commentary reacts to macro headlines rather than corporate balance sheets. If the underlying earnings and free cash flow remain stable, narrowing that gap requires either a shift in public tone or a re-pricing that matches the operating cash flow.
Volume and price extremes
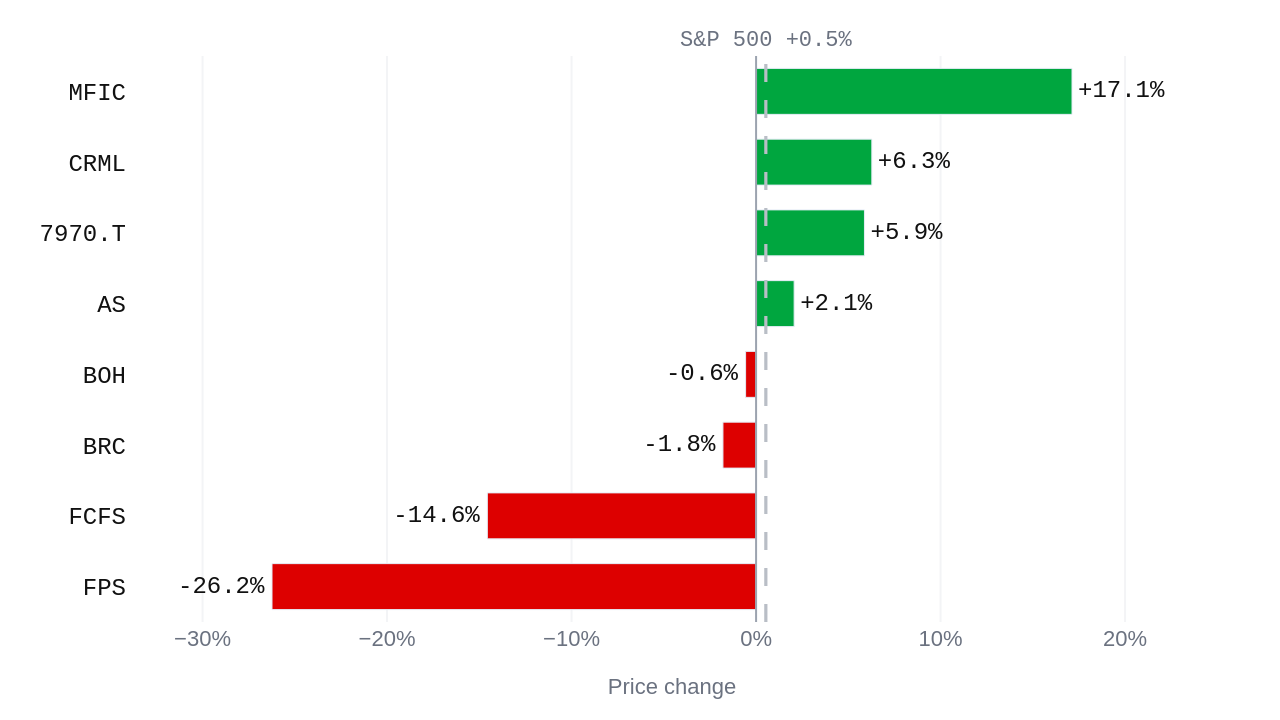
Where prices moved sharply during the fortnight, the relationship between volume and fundamentals offers a different test of what the market believes. Forgent Power Solutions, Inc. (FPS), with a market value of $8.2 billion, a price-to-earnings ratio of 94.93, earnings per share of $0.27, zero dividend yield, and negative free cash flow of $27.0 million, experienced unusually heavy selling, falling 21.5% on 5.7 times its usual volume. FirstCash Holdings, Inc (FCFS), valued at $8.0 billion with a price-to-earnings ratio of 20.08, earnings per share of $9.19, a dividend yield of 0.91%, and free cash flow of $472.0 million, saw similar selling pressure, dropping 14.7% on 5.8 times its usual volume. Conversely, buying concentration appeared elsewhere. Critical Metals Corp. (CRML), carrying a market value of $1.2 billion, a negative price-to-earnings ratio of 4.32, earnings per share of negative $1.73, zero dividend yield, and negative free cash flow of $42.6 million, rose 27.4% on 3.8 times its usual volume. International exposure showed parallel extremes. Shin-Etsu Polymer Co.,Ltd. (Tokyo: 7970), with a market value of $1.3 billion, a price-to-earnings ratio of 19.28, earnings per share of $0.83, a dividend yield of 2.7%, zero free cash flow, and an additional country risk premium for Japan of 0.91%, advanced 12.0% on 10.3 times its usual volume. These moves demonstrate that heavy trading volume acts as a blunt instrument. When evaluating such signals, the practical question for an investor is what the transaction means for the underlying claim on cash rather than the mechanical order flow. If volume expands without a corresponding change in free cash flow, the price movement reflects changing sentiment among market participants rather than a permanent alteration of the business.
Weighing perception against reality
The evidence from the period does not settle whether public coverage or operating numbers will dictate future valuations. Inflation expectations ticked up to 2.35% from the previous reading, remaining within a historically narrow band. What the data does establish is that where sentiment and ledgers disagree, relying on the outcome for cash generation rather than the methodology of the commentary provides a stable anchor. If the current operating figures hold while external coverage remains pessimistic, the resolution depends on whether corporate cash returns override media narratives. When external commentary and internal ledgers part ways, the lasting measure of an asset remains the cash it returns to its owners.
| Symbol | Change over 28 Sep - 27 Oct 2026 | Versus the S&P 500 |
|---|---|---|
| 7970.T | +5.9% | +5.3 pts |
| AS | +2.1% | +1.5 pts |
| BOH | -0.6% | -1.1 pts |
| BRC | -1.8% | -2.3 pts |
| CRML | +6.3% | +5.7 pts |
| FCFS | -14.6% | -15.1 pts |
| FPS | -26.2% | -26.8 pts |
| MFIC | +17.1% | +16.6 pts |
Questions readers ask
What was the consumer sentiment for the US economy?
Consumer sentiment was 48.1 when measured on 2026-09-01, which is down 3.6 from the previous reading.
What was the market value and dividend yield for Bank of Hawaii Corporation?
Bank of Hawaii Corporation (BOH) had a market value of $2.8 billion and a dividend yield of 4.0% when measured on 2026-10-28.
How did Forgent Power Solutions, Inc. perform during the unusually heavy selling?
Forgent Power Solutions, Inc. (FPS) was down 21.5% on 5.7× its usual volume.
What was the unemployment rate for the US economy?
The unemployment rate was 4.2% when measured on 2026-09-01, which is up 0.1% from the previous reading.