Divergence between public coverage and fundamental metrics
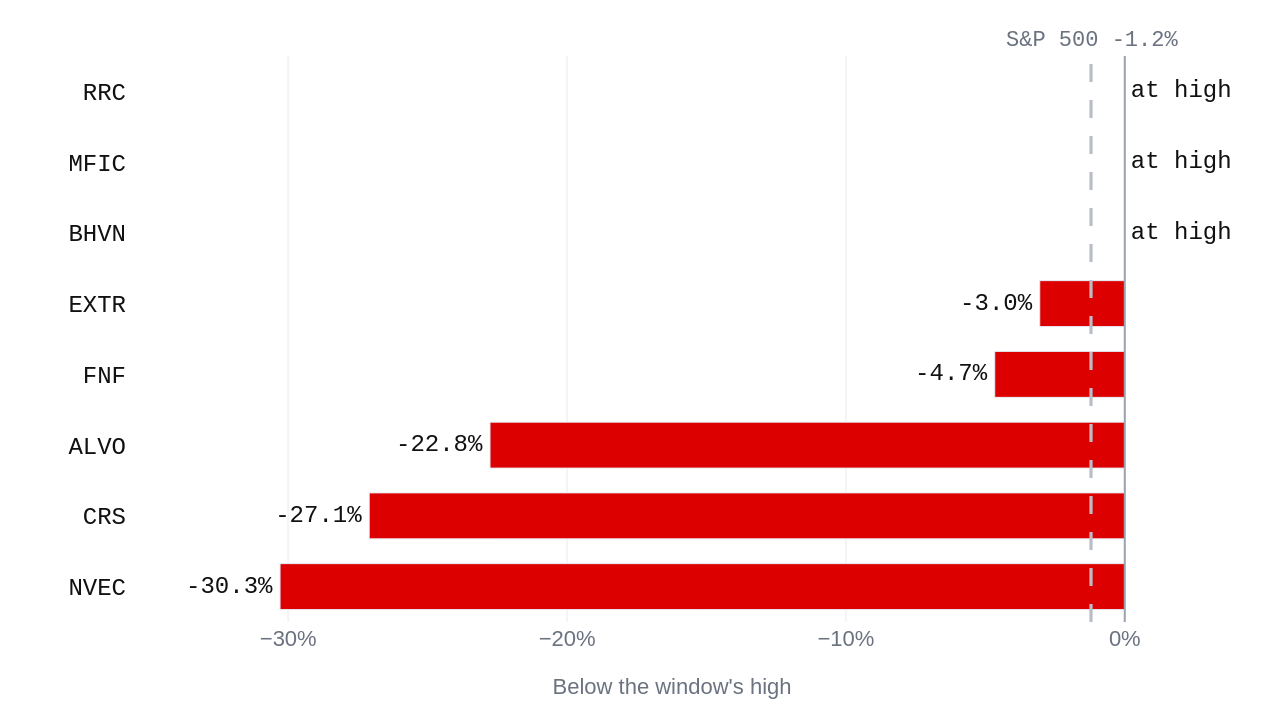
The disagreements across this period do not share a single cause, demonstrating that public coverage and underlying financial numbers are currently agreeing on very little. Consumer sentiment fell 3.6 to 48.1 while non-farm payrolls rose 29,000 to 159.0 million, unemployment ticked up to 4.2%, and retail sales grew $4.7 billion to $652.1 billion. These macro figures sit alongside individual equities where stories and numbers point in opposite directions. Alvotech maintained an upbeat coverage tone even as its numbers softened, holding a gap between 2.5 and 2.49 standard deviations all week. Conversely, Extreme Networks and Fidelity National Financial saw their coverage turn negative while their numbers held up, maintaining positive gaps of 2.27 to 2.37 standard deviations. These disconnects do not stem from a unified root; rather, they show that headline sentiment and underlying operations frequently measure entirely separate phenomena.
Evaluating per share dilution and operational reality
To determine whether a company's reported expansion reflects genuine operational health or simply an expanding share count, one must ask whether per-share earnings keep pace with top-line growth. This method measures the relationship between revenue generation and per-share profitability while deliberately ignoring short-term price volatility and qualitative editorial tone. Applying this to Carpenter Technology, which traded down 20.6% on 4.0 times its usual volume with a market value of $14.3 billion and earnings per share of $11.44 against a price-to-earnings ratio of 25.31, illustrates how heavy stock compensation or share issuance alters the picture before it appears in standard revenue summaries. If a company's revenue scales while earnings per share remain flat or decline, the underlying share count is likely rising, revealing dilution that headline figures obscure. A reader would see that this method is inappropriate when applied to businesses undergoing non-recurring asset sales or rapid debt restructuring, where per-share metrics fluctuate independently of operating dilution.
The asymmetry of holding through divergence
The current situation presents a stark divergence between asset prices and underlying reporting across multiple equities. If the optimistic reading is wrong and a company like Biohaven, which experienced extreme volume at 16.0 times its usual volume with a market value of $2.3 billion and negative free cash flow of $511.9 million, faces prolonged operational burn, the holder absorbs the full cost of capital deterioration without cash flow support. If the cautious reading is wrong and steady performers like Fidelity National Financial, with a market value of $10.6 billion, a dividend yield of 5.27%, and earnings per share of $2.89, continue to generate strong free cash flow of $5.8 billion despite negative coverage, the holder misses out on capital appreciation by exiting prematurely. These two costs are not the same size; the penalty for misjudging deteriorating cash burn in high-volume situations like Biohaven or NVE Corporation—which fell 33.7% on 5.0 times its usual volume with a market value of $393.5 million—exceeds the opportunity cost of holding through pessimistic headlines on stable cash generators. This asymmetry becomes narrower if interest rates shift significantly or if inflation expectations move away from 2.35%, and it widens if volume anomalies like Range Resources rising 17.7% on 9.8 times its usual volume persist without supporting fundamental earnings expansion.
| Symbol | Below the high over 28 Sep - 27 Oct 2026 | Versus the S&P 500 |
|---|---|---|
| ALVO | -22.8% | -21.6 pts |
| BHVN | at its high | +1.2 pts |
| CRS | -27.1% | -25.9 pts |
| EXTR | -3.0% | -1.8 pts |
| FNF | -4.7% | -3.5 pts |
| MFIC | at its high | +1.2 pts |
| NVEC | -30.3% | -29.1 pts |
| RRC | at its high | +1.2 pts |
Questions readers ask
What were the retail sales for the US economy?
Retail sales reached $652.1 billion, which was up $4.7 billion from the previous reading.
What were the earnings per share and free cash flow for Alvotech (ALVO)?
Alvotech (ALVO) had earnings per share of $-0.50 and a free cash flow of $-300.2 million, along with a market value of $1.7 billion.
What was the closing gap and dividend yield for Fidelity National Financial, Inc. (FNF)?
Fidelity National Financial, Inc. (FNF) had a closing gap of 2.37 std devs and a dividend yield of 5.27%, with earnings per share at $2.89.
What was the market value and volume change for Range Resources Corporation (RRC)?
Range Resources Corporation (RRC) had a market value of $13.2 billion and was up 17.7% on 9.8× its usual volume.