Coverage and financials diverge across different fault lines
Revisiting prior disagreements
Issue thirteen examined whether public commentary and underlying financials agreed on anything at all, concluding that names like Popular, Inc. and BP p.l.c. displayed wide gaps that did not share a cause. The durable analytical model concerning fixed-income duration and credit spreads does not find purchase in this fortnight's evidence, because the market's activity centers entirely on equities, corporate financials, and macroeconomic releases rather than bond portfolios. An idea the market declined to illustrate is a finding in itself, leaving us to examine what the actual evidence shows about how commentary and numbers interact.
How the gaps evolved since
The separation between coverage and financials resolved differently across the companies observed when the period opened on October 21, 2026. For Popular, Inc., which carried a market value of $10.2 billion with a price to earnings ratio of 10.02, earnings per share of $16.23, a dividend yield of 1.98%, and free cash flow of $807.2 million as of October 28, 2026, the gap when the period opened stood at 2.33 standard deviations. By October 26, 2026, backed by 10 articles, that gap closed to 1.75 standard deviations as the market came around. For AstraZeneca PLC, possessing a market value of $263.8 billion, a price to earnings ratio of 25.28, earnings per share of $6.73, a dividend yield of 1.87%, and free cash flow of $8.5 billion, the gap opened at 1.79 standard deviations and closed at 1.75 standard deviations across 11 articles by October 26, 2026, holding all week as neither side moved despite negative coverage against stable numbers. BP p.l.c., holding a market value of $128.3 billion, a price to earnings ratio of 23.65, earnings per share of $2.08, a dividend yield of 4.09%, and free cash flow of $16.4 billion, opened at 2.33 standard deviations and moved only slightly to 2.28 standard deviations across 7 articles, holding the gap all week as negative coverage persisted alongside steady underlying financials.
Volume extremes and price reactions
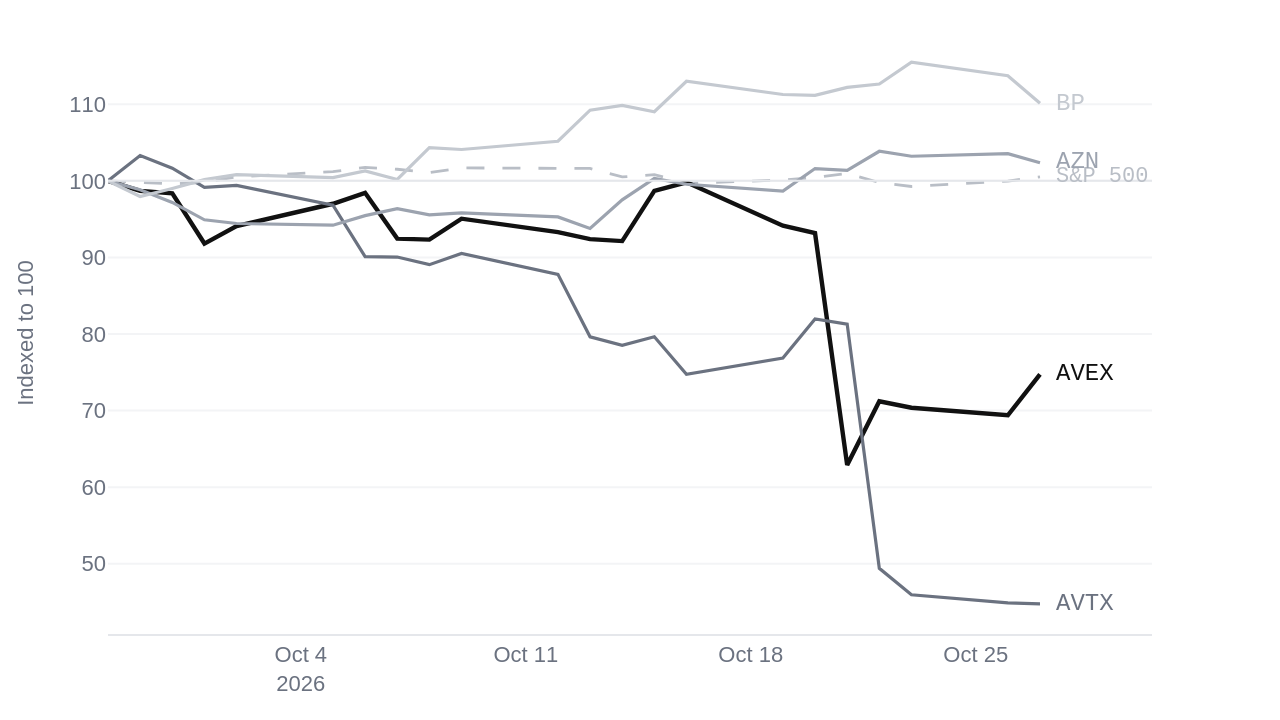
Other equities experienced extreme volume movements that tested the relationship between price action and underlying business value. XP Inc., with a market value of $8.3 billion, a price to earnings ratio of 8.31, earnings per share of $1.94, a dividend yield of 2.38%, and free cash flow of $4.0 billion, recorded extreme volume at 10.1 times its usual level after a long run, trading at 14.4 times its normal volume. Surgery Partners, Inc., holding a market value of $3.1 billion, a price to earnings ratio of -33.86, earnings per share of -0.69 dollars, a dividend yield of 0.0%, and free cash flow of $187.6 million, experienced unusually heavy buying, rising 47.6% on 33.4 times its usual volume. Conversely, Avalo Therapeutics, Inc., with a market value of $362.0 million, a price to earnings ratio of -1.42, earnings per share of -2.30 dollars, a dividend yield of 0.0%, and free cash flow of -66.4 million dollars, suffered unusually heavy selling, falling 39.2% on 22.7 times its usual volume. Aevex Corp., holding a market value of $649.4 million, a price to earnings ratio of 26.67, earnings per share of 0.81 dollars, a dividend yield of 0.0%, and free cash flow of $5.3 million, saw heavy selling that drove it down 32.5% on 7.5 times its usual volume.
Macroeconomic signals and institutional commentary
These corporate movements occurred against a backdrop of conflicting macroeconomic indicators published across the period. Consumer sentiment fell 3.6 points to 48.1 from the reading measured on September 1, 2026, while inflation expectations ticked up 0.01% to 2.35% as of October 27, 2026. Simultaneously, non-farm payrolls rose by 29,000 to reach 159.0 million, retail sales grew by $4.7 billion to reach $652.1 billion, and the unemployment rate ticked up 0.1% to 4.2% as of September 1, 2026. Institutional commentary addressed these conditions through speeches from Federal Reserve Vice Chair Jefferson and Governor Waller on the United States economy and monetary policy, alongside analytical reports from the Bank for International Settlements and the St. Louis Federal Reserve flash report on unemployment flows in September.
What the divergence implies
Taken together, these disagreements do not point to a single unifying cause. When consumer sentiment drops while payrolls and retail sales expand, public perception and quantitative measures pull in opposite directions. Similarly, when some equity gaps close while others hold steady despite negative coverage, the evidence shows that the market does not apply a uniform standard for resolving informational disconnects. Commentary and numbers are currently agreeing only selectively, with each asset and indicator responding to its own specific incentives and pressures rather than a general macro narrative.
| Symbol | Change over 21-27 Oct 2026 | Versus the S&P 500 |
|---|---|---|
| AVEX | -25.3% | -25.8 pts |
| AVTX | -55.2% | -55.8 pts |
| AZN | +2.4% | +1.8 pts |
| BP | +10.1% | +9.6 pts |
Questions readers ask
What happened to consumer sentiment and retail sales in the US economy?
Consumer sentiment was measured at 48.1 on September 1, 2026, which was down 3.6 from the previous reading. At the same time, retail sales reached $652.1 billion on September 1, 2026, showing an increase of $4.7 billion from the previous reading.
What are the market value and free cash flow for Popular, Inc. (BPOP)?
Popular, Inc. (BPOP) has a market value of $10.2 billion and free cash flow of $807.2 million, measured on October 28, 2026. Its gap opened at 2.33 standard deviations and closed at 1.75 standard deviations on October 26, 2026, with 10 articles behind that latest reading.
How did Surgery Partners, Inc. (SGRY) perform in trading volume and price change?
Surgery Partners, Inc. (SGRY) went up 47.6% on 33.4 times its usual volume, showing unusually heavy buying. It has a market value of $3.1 billion and free cash flow of $187.6 million, as measured on October 28, 2026.
What are the earnings per share and dividend yield for BP p.l.c. (BP)?
BP p.l.c. (BP) has earnings per share of $2.08 and a dividend yield of 4.09%, measured on October 28, 2026. Its gap opened at 2.33 standard deviations and closed at 2.28 standard deviations on October 26, 2026, with 7 articles behind the latest reading.