The divergence between public text and underlying metrics
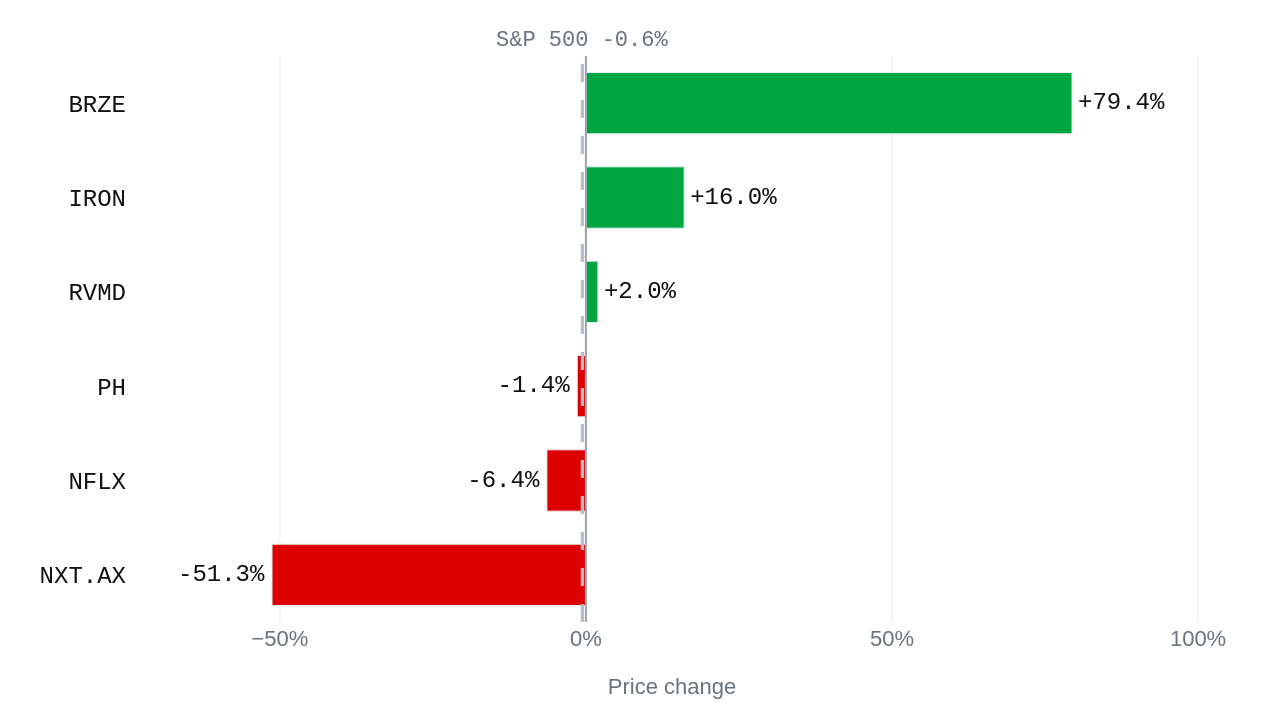
The divergence between narrative and metrics
When public commentary moves in one direction while underlying financial metrics move in another, a statistical gap opens between narrative and reality. Over the fortnight ending October 20, 2026, this pattern appeared across multiple equities alongside broader economic readings of inflation expectations at 2.35%, non-farm payrolls at 159.0 million up 29,000, retail sales at $652.1 billion up $4.7 billion, and unemployment at 4.2% up 0.1%. A portfolio holder observing these movements notes that public commentary and underlying financials do not always agree. The evidence shows that the nature of this disagreement depends entirely on which direction the gap opens.
When upbeat coverage meets negative cash flow
The pattern appears first in Revolution Medicines, Inc. (RVMD), where coverage stayed upbeat while numbers softened. The market has had a full period to close the gap and has not. The gap stood at -3.45 standard deviations when the period opened on October 16, 2026, and closed at -3.49 standard deviations on October 20, 2026, with neither side moving across 10 articles behind the latest reading. Revolution Medicines, Inc. (RVMD) carries a market value of $42.1 billion, a price-to-earnings ratio of -22.18, earnings per share of $-8.38, a dividend yield of 0.0%, and free cash flow of $-1.2 billion. In this setting, the positive narrative persists despite negative earnings and negative free cash flow, showing that risk can build quietly while the story still reads well.
When negative headlines mask underlying strength
The same pattern appears again in Netflix, Inc. (NFLX) and Parker-Hannifin Corporation (PH), but with the signs reversed. For Netflix, Inc. (NFLX), coverage turned negative while numbers held up, holding a gap of 2.87 standard deviations behind 9 articles on October 15, 2026. Netflix, Inc. (NFLX) carries a market value of $286.0 billion, a price-to-earnings ratio of 19.51, earnings per share of $3.57, a dividend yield of 0.0%, and free cash flow of $11.4 billion. Similarly, for Parker-Hannifin Corporation (PH), coverage turned negative while numbers held up, holding a gap of 2.34 standard deviations between October 16 and October 20, 2026, across 6 articles. Parker-Hannifin Corporation (PH) carries a market value of $119.1 billion, a price-to-earnings ratio of 32.69, earnings per share of $28.93, a dividend yield of 0.8%, and free cash flow of $3.9 billion. Here, negative headlines accompany positive earnings and substantial positive free cash flow.
The fundamental divide in cash generation
Why the same pattern means something different in these two settings lies in the financial reality beneath the text. The difference between Revolution Medicines, Inc. (RVMD) and companies like Netflix, Inc. (NFLX) or Parker-Hannifin Corporation (PH) is the direction of cash generation. In the first instance, an upbeat story papers over negative free cash flow of $-1.2 billion and negative earnings. In the second instance, negative media coverage discounts businesses producing positive free cash flow of $11.4 billion and $3.9 billion respectively. Extreme volume shifts across other holdings, such as Silence Therapeutics plc (SLN) trading at 65.9 times its normal volume with a market value of $926.3 million, a price-to-earnings ratio of -5.15, earnings per share of $-3.81, a dividend yield of 0.0%, and free cash flow of $-42.3 million, or Braze, Inc. (BRZE) rising 51.7% on 32.7 times its usual volume with a market value of $5.2 billion, a price-to-earnings ratio of -44.24, earnings per share of $-1.02, a dividend yield of 0.0%, and free cash flow of $83.6 million, or Disc Medicine, Inc. (IRON) rising 38.9% on 13.5 times its usual volume with a market value of $3.1 billion, a price-to-earnings ratio of -12.04, earnings per share of $-6.36, a dividend yield of 0.0%, and free cash flow of $-197.6 million, or NEXTDC Limited (Sydney: NXT) falling 41.7% on 14.3 times its usual volume with an additional country risk premium for Australia of 0.0%, a market value of $2.8 billion, a price-to-earnings ratio of 41.60, earnings per share of $0.09, a dividend yield of 0.0%, and free cash flow of $-1.4 billion, further illustrate that statistical divergence is not a uniform signal; its meaning is inverted by the presence or absence of cash earnings.
Diversification and the structure of holdings
This brings us to the durable principle governing portfolio risk. Diversification is the one adjustment that can reduce risk without a matching reduction in expected return, provided the holdings are genuinely different. That proviso is where most portfolios fail. True portfolio separation requires independence in the underlying generation of cash rather than mere dispersion in ticker symbols.
| Symbol | Change over 21 Sep - 21 Oct 2026 | Versus the S&P 500 |
|---|---|---|
| BRZE | +79.4% | +80.0 pts |
| IRON | +16.0% | +16.6 pts |
| NFLX | -6.4% | -5.8 pts |
| NXT.AX | -51.3% | -50.7 pts |
| PH | -1.4% | -0.8 pts |
| RVMD | +2.0% | +2.5 pts |
Questions readers ask
What are the market value and free cash flow for Revolution Medicines, Inc. (RVMD)?
Revolution Medicines, Inc. has a market value of $42.1 billion and a free cash flow of $-1.2 billion. The gap when it closed was -3.49 std devs, meaning the coverage stayed upbeat while the numbers softened.
What are the market value and free cash flow for Netflix, Inc. (NFLX)?
Netflix, Inc. has a market value of $286.0 billion and a free cash flow of $11.4 billion. The gap when it closed was 2.87 std devs, meaning coverage turned negative while the numbers held up.
What is the market value and volume for Silence Therapeutics plc (SLN)?
Silence Therapeutics plc has a market value of $9 propiedad. It reached 65.9× its normal volume, showing extreme volume after a long run.
What are the latest retail sales and unemployment rate for the US economy?
US retail sales are $652.1 billion, up $4.7 billion from the previous reading. The unemployment rate is 4.2%, up 0.1% from the previous reading.