Assessing divergence between market coverage and financials
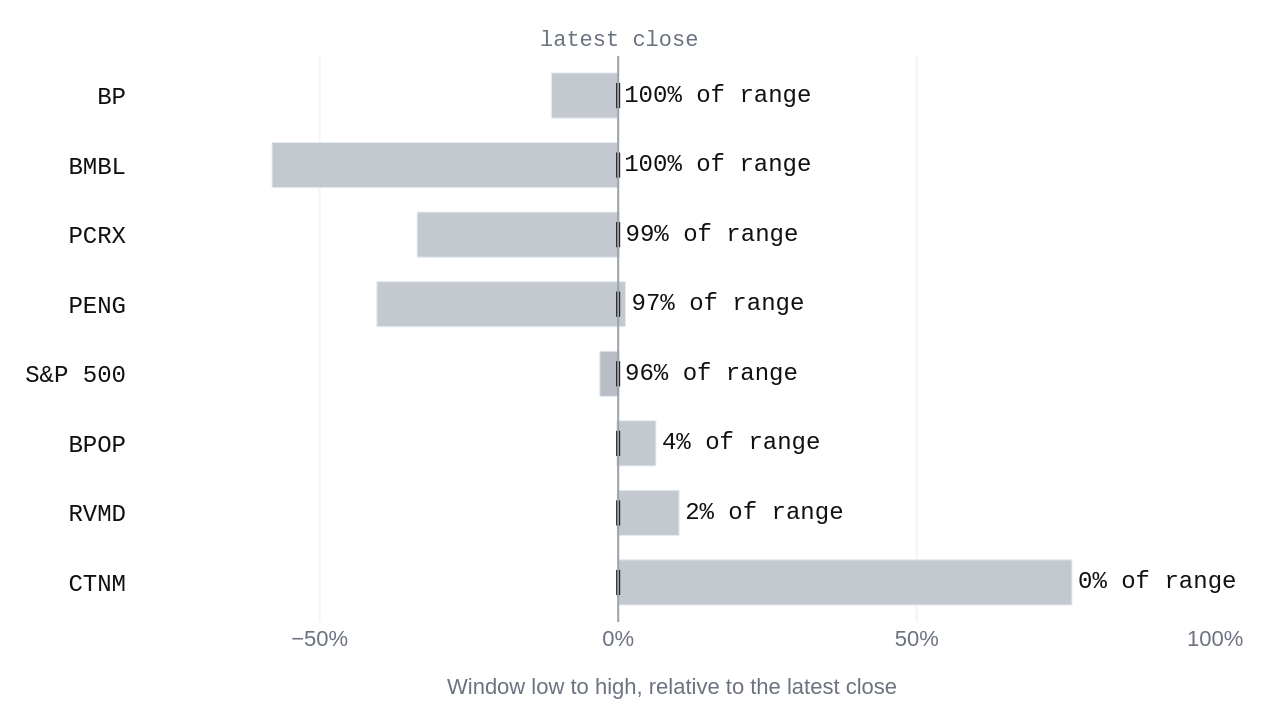
A holder watching these wide market movements is asking whether public commentary and underlying financials are currently agreeing on anything at all. The coverage and the numbers are not agreeing at all this fortnight, because these disagreements do not share a common cause and instead operate on entirely separate tracks.
Assessing the gap between narrative and numbers
Revolution Medicines, Inc. (RVMD) shows upbeat coverage while its numbers soften, with the valuation gap moving from -3.53 standard deviations when the period opened on October 8, 2026, to -3.36 standard deviations when it closed on October 13, 2026, across 10 articles. RVMD carries a market value of $40.1 billion, negative free cash flow of $-1.2 billion, earnings per share of $-8.38, and a negative price-to-earnings ratio of -21.27. Conversely, BP p.l.c. (BP) and Popular, Inc. (BPOP) exhibit negative coverage while their financials hold firm. For BP, the gap held steady all week at 2.37 standard deviations across 8 articles, backed by a market value of $127.3 billion, earnings per share of $2.08, free cash flow of $16.4 billion, a dividend yield of 4.13%, and a price-to-earnings ratio of 23.43. For BPOP, the gap also held flat all week at 2.37 standard deviations across 8 articles, supported by a market value of $10.0 billion, earnings per share of $15.17, free cash flow of $807.2 million, a dividend yield of 2.02%, and a price-to-earnings ratio of 10.51.
Compound signals and volume divergence
The narrative persistence trap. In RVMD, upbeat media framing continues to anchor valuation at $40.1 billion despite $-1.2 billion in free cash flow, proving that stories can maintain price support independently of cash generation.
The cash generation shield. In BP and BPOP, negative coverage fails to depress valuations because $16.4 billion in free cash flow for BP and $807.2 million in free cash flow for BPOP provide tangible returns through dividend yields of 4.13% and 2.02% respectively, overriding media pessimism.
The volume divergence. Unusually heavy buying and selling across smaller capitalisations highlight where market participants are acting outside the narrative baseline. Bumble Inc. (BMBL) traded up 56.6% on 29.1 times its normal volume, carrying a market value of $776.1 million, free cash flow of $255.0 million, earnings per share of $-4.02, and a price-to-earnings ratio of -1.54. Pacira BioSciences, Inc. (PCRX) rose 44.4% on 51.1 times its normal volume, with a market value of $1.4 billion, free cash flow of $179.5 million, earnings per share of $0.37, and a price-to-earnings ratio of 103.12. Contineum Therapeutics, Inc. (CTNM) experienced heavy selling down 35.9% on 10.3 times its normal volume, holding a market value of $316.8 million, negative free cash flow of $-53.5 million, earnings per share of $-1.54, and a price-to-earnings ratio of -4.87. Penguin Solutions, Inc. (PENG) rose 13.1% on 9.2 times its normal volume, with a market value of $4.0 billion, free cash flow of $-166.9 million, earnings per share of $3.24, and a price-to-earnings ratio of 27.75.
Testing the limits of the evidence
The strongest case against this view holds that these valuation gaps and volume surges are merely temporary noise driven by sector-specific news cycles that carry no structural weight for a broader portfolio, particularly when the wider US economy maintains stability with non-farm payrolls at 159.0 million, an unemployment rate of 4.2%, and inflation expectations anchored at 2.33%. In this view, consumer sentiment resting at 51.7 after falling 3.5 points and a federal funds rate of 3.75% after a 0.12% increase set a macroeconomic boundary that eventually pulls all divergent equities back to their fundamental mean without requiring action from a holder.
This counter-argument rests on the assumption that macroeconomic gravity is stronger than micro-level narrative divergence. Yet the evidence from this fortnight shows that different sectors are responding to entirely different internal logics, making a uniform macroeconomic pull unlikely. What the current evidence cannot settle is whether the heavy volume in names like BMBL and PCRX reflects fundamental repositioning by informed capital or short-term speculative positioning that will reverse once sentiment shifts.
A holder watching these dynamics should monitor whether the valuation gaps on BP and BPOP narrow toward zero while their free cash flow remains positive, or whether RVMD's negative free cash flow eventually breaches the narrative support keeping its valuation at $40.1 billion. If the valuation gaps on the cash-generative holdings close without a shift in public coverage, the conclusion that narrative and numbers operate independently would weaken, suggesting that cash generation exerts an unavoidable gravitational pull over time.
| Symbol | Window low vs latest | Window high vs latest | Latest in range |
|---|---|---|---|
| BMBL | -58.0% | +0.0% | 100% |
| BP | -11.2% | +0.0% | 100% |
| BPOP | -0.2% | +6.3% | 4% |
| CTNM | +0.0% | +76.0% | 0% |
| PCRX | -33.7% | +0.2% | 99% |
| PENG | -40.4% | +1.2% | 97% |
| RVMD | -0.2% | +10.2% | 2% |
| S&P 500 | -3.1% | +0.1% | 96% |
Questions readers ask
What was the federal funds rate for the US economy?
The federal funds rate was 3.75% as of 2026-09-01, which is up 0.12% from the previous reading. This measurement shows the rate increased slightly over the prior period.
What was the market value and opening gap for Revolution Medicines, Inc. (RVMD)?
Revolution Medicines, Inc. (RVMD) had a market value of $40.1 billion measured on 2026-10-14. The gap when the period opened was -3.53 standard deviations on 2026-10-08.
How did Bumble Inc. (BMBL) perform in terms of volume and earnings per share?
Bumble Inc. (BMBL) was up 56.6% on 29.1 times its usual volume, and its earnings per share was -$4.02 as measured on 2026-10-14.
What was the unemployment rate for the US economy?
The unemployment rate was 4.2% as of 2026-09-01, which was up 0.1% from the previous reading. This reflects a minor rise in the rate.