Lucid Group and the persistence of unclosed valuation gaps
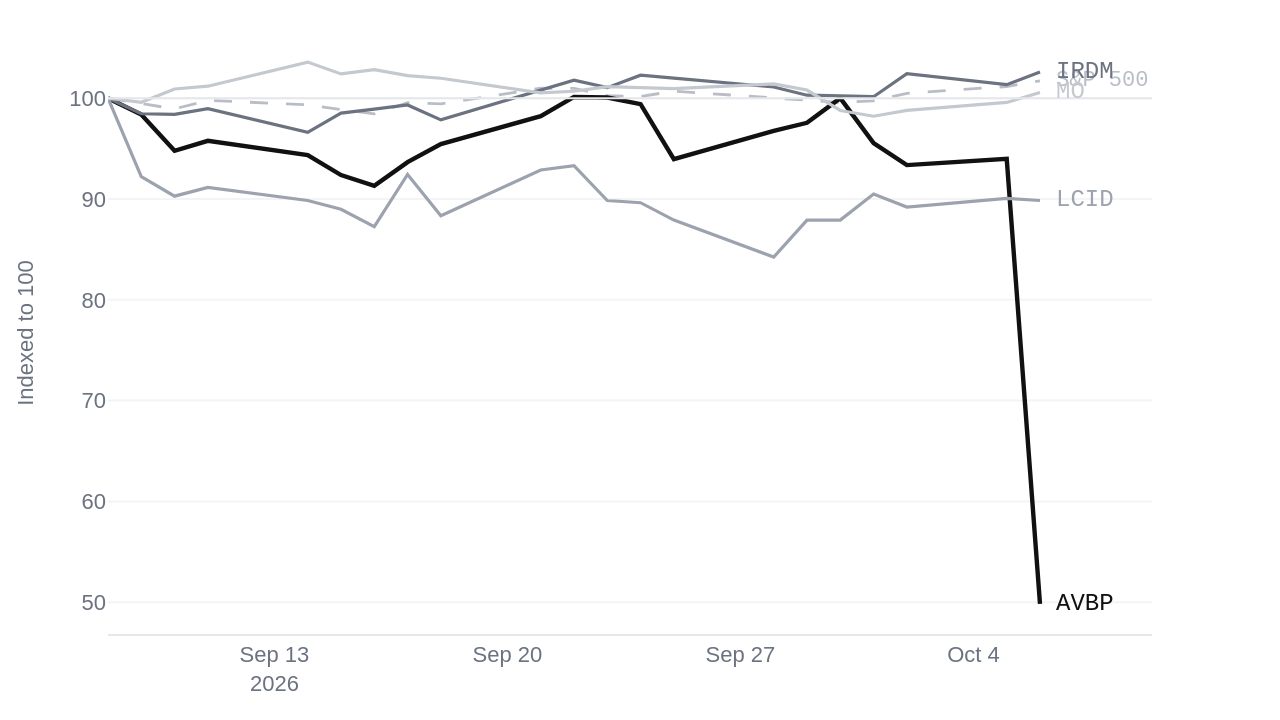
The market has left the valuation gap on Lucid Group, Inc. (LCID) unchanged at -2.09 standard deviations across the fortnight because asset pricing often reflects the durability of a story rather than the immediate constraint of its financials. When nine articles support an upbeat coverage tone while earnings per share sit at $-10.68 and the market value rests at $1.3 billion with a price to earnings ratio of -0.30, the obvious reading is that the market is simply slow to absorb deteriorating conditions. Most observers look at the soft numbers, look at the upbeat descriptions, and assume a correction is overdue.
Evaluating cash against reported results
That obvious reading misses how accounting metrics and narrative momentum interact over time. The question this method answers for a holder is whether a company's reported figures are tethered to actual cash generation or sustained by accounting constructs and external storytelling. It measures the persistence of profit or loss relative to cash flows over multi-year horizons while deliberately ignoring short-term price volatility and media sentiment. On Lucid Group, Inc. (LCID), the earnings per share of $-10.68 and zero dividend yield show an absence of cash-backed returns entirely, which explains why the gap at -2.09 standard deviations persists without attracting rationalizing capital from value buyers. The market does not close the gap because there is no underlying cash stream to anchor a fundamental recalculation.
The divergence between narrative and numbers
The same dynamic appears in reverse elsewhere in the market, showing that the method operates across different valuation extremes. Altria Group, Inc. (MO) closed the fortnight with a gap of 2.30 standard deviations, down slightly from 2.34 at the period's open, despite five articles carrying negative coverage. Yet Altria Group, Inc. (MO) supports its position with $8.3 billion in free cash flow, an earnings per share of $4.77, and a dividend yield of 6.26% on a market value of $114.5 billion. Similarly, Iridium Communications Inc. (IRDM) held a gap of 2.30 standard deviations with negative coverage while generating $288.3 million in free cash flow and an earnings per share of $0.87 on a $5.2 billion market value. In both cases, negative coverage failed to erode valuations because the underlying cash generation matched or exceeded reported earnings, providing an anchor that stories alone could not dislodge.
What changes for a long-term holder
For someone holding a diversified, risk-cautious portfolio, these persistent gaps reveal the limits of relying on news flow or sentiment to gauge asset safety. When a company like Lucid Group, Inc. (LCID) maintains a wide negative gap while coverage remains upbeat, or when cash-generating businesses maintain positive gaps despite negative headlines, the underlying cash flow data tells the reliable story. For a holder, this means ignoring the volume of articles—nine in the case of Lucid Group, Inc. (LCID) and five each for Altria Group, Inc. (MO) and Iridium Communications Inc. (IRDM)—and instead examining whether the cash generation supports the valuation. If cash matches profit, a negative headline is noise; if cash is absent or negative while losses deepen, upbeat coverage is a warning of unrecognised risk.
Where the evidence stops
There are conditions where this cash-first method fails to explain market pricing. If a company operates in a sector where capital expenditures precede revenue by decades or where balance sheet reserves allow operations to continue indefinitely without positive free cash flow, cash metrics alone will signal distress while the market continues to price in future optionality. For Lucid Group, Inc. (LCID), one could argue that external funding access or structural shifts in vehicle adoption could render current cash losses irrelevant to its long-term terminal value. The evidence during this fortnight cannot settle whether that optionality justifies the current market value of $1.3 billion. What would confirm the reading either way is a sustained shift in operating cash generation relative to financing needs, or a structural contraction in available capital that forces a reconciliation between the story and the balance sheet.
| Symbol | Change over 30 Sep - 06 Oct 2026 | Versus the S&P 500 |
|---|---|---|
| AVBP | -50.2% | -51.9 pts |
| IRDM | +2.6% | +0.9 pts |
| LCID | -10.2% | -11.9 pts |
| MO | +0.6% | -1.2 pts |
Questions readers ask
What was the market value and earnings per share for Lucid Group, Inc. (LCID)?
Lucid Group, Inc. had a market value of $1.3 billion and earnings per share of $-10.68 when measured on October 7, 2026.
What were the market value and free cash flow for Altria Group, Inc. (MO)?
Altria Group, Inc. had a market value of $114.5 billion and a free cash flow of $8.3 billion as of October 7, 2026.
What was the unemployment rate for the United States economy?
The United States unemployment rate was 4.2 percent on September 1, 2026, representing an increase of 0.1 percent from the previous reading.
What was the market value for RXO, Inc. (RXO)?
RXO, Inc. had a market value of $4.7 billion when measured on October 7, 2026, alongside unusually heavy buying up 22.5 percent on 10.9 times its usual volume.