The persistent gap between market narrative and corporate cash flows
The persistence of narrative divergence
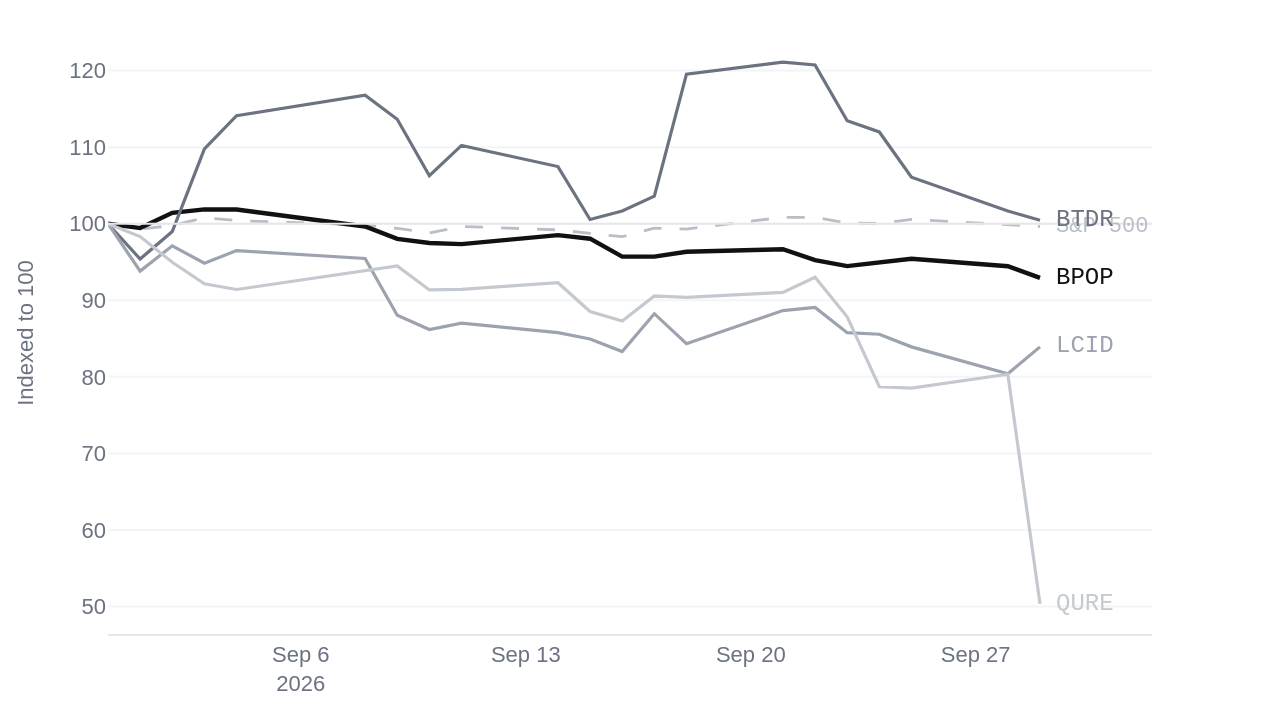
The market's failure to close the valuation gap on Popular, Inc. (BPOP) over the last fortnight shows that narrative-driven pricing can resist the gravity of strong cash generation even when public commentary turns negative. In our previous issue, we suggested that wide statistical anomalies between market sentiment and financial reality tend to resolve quickly as market participants digest new information. The current period has contradicted this expectation. The valuation gap for Popular, Inc. opened at 2.30 standard deviations on September 24 and closed virtually unchanged at 2.28 standard deviations on September 28. During this time, media coverage turned negative, with 7 articles behind the latest reading on September 28. Despite trading 20.7 times its normal volume, the gap held all week, meaning neither side moved. This persistence suggests that the market has already priced in a specific set of assumptions that negative headlines alone cannot dislodge. For a risk-cautious holder of US equities, this is a reminder that prices do not automatically align with fundamentals on a predictable schedule.
The structural limits of reported earnings
To understand why these valuation gaps persist, we must examine a word that investors often use loosely: "earnings." In common conversation, earnings are generally taken to mean the actual cash a business pockets at the end of the day. In practice, however, earnings measure net income calculated under accrual accounting rules. This system records revenues when a transaction is completed and matches them against the expenses incurred to generate them, regardless of when cash actually changes hands.
The two concepts come apart because accrual adjustments can create a wide gap between reported net income and actual cash generated from operations. Under this framework, a company can report substantial accounting profits while its operating cash flows remain weak or negative. Conversely, a business may generate robust cash flows that are obscured by non-cash accounting charges. For a long-term investor, persistent profit without matching cash flow is one of the most reliable indicators of structural risk, as accrual accounting allows management to recognize revenue long before the cash arrives to support it.
Evaluating cash flows against market narratives
The current period provides clear examples of this divergence across different holdings, illustrating how risk can build quietly while the public story remains attractive. Popular, Inc., with a market value of $10.0 billion, reports earnings per share of $15.17 and a price-to-earnings ratio of 10.55. More importantly, its free cash flow stands at $807.2 million, supporting a dividend yield of 2.02%. Despite negative public coverage, the company's cash generation remains aligned with its reported earnings. The market's refusal to close the positive valuation gap suggests that investors are demanding a higher risk premium than the historical average, perhaps reflecting broader macroeconomic uncertainties.
In contrast, we see the opposite pattern in names like Lucid Group, Inc. (LCID) and Bitdeer Technologies Group (BTDR). For Lucid Group, which has a market value of $1.3 billion, public coverage remained upbeat during the period even as its financial numbers softened. Lucid reports earnings per share of $-10.68 and a price-to-earnings ratio of -0.30, with free cash flow at $-6.6 billion. Its valuation gap opened at -2.10 standard deviations on September 25 and closed at -2.08 standard deviations on September 29, with 8 articles behind the latest reading. The gap held all week, and neither side moved. Similarly, Bitdeer, with a market value of $2.5 billion, saw its valuation gap move from -1.97 standard deviations on September 24 to -2.07 standard deviations on September 28, with 8 articles behind the latest reading. This gap also held all week, with neither side moving, while its coverage stayed positive despite a free cash flow of $-2.1 billion and earnings per share of $-1.82.
In both cases, positive narrative coverage has masked deeply negative cash flows. The mechanical consequence of holding assets where cash outflows persistently exceed earnings is a reliance on external financing, either through debt or equity dilution, which eventually erodes shareholder value.
What the evidence cannot settle
What this precise reading of cash flow cannot settle is the timing of any market correction. While the divergence between cash flow and narrative is clear, the evidence does not tell us when—or even if—the market will re-align these prices with their underlying cash realities. A cautious investor cannot assume that Popular, Inc. will quickly rise to close its positive gap, nor that Lucid Group or Bitdeer will immediately decline.
An objection to this view is that Popular, Inc. operates in a regulated financial sector where cash flows can be highly volatile and do not map directly to industrial cash cycles. A bank's free cash flow can be distorted by deposit movements and loan originations, meaning the apparent cash surplus might not be as freely distributable as it appears in a standard cash flow statement. If this objection holds, the market's cautious valuation of Popular, Inc. may be more rational than the simple comparison of earnings to cash flow suggests.
To change our reading of these positions, we would need to see a shift in the structural conditions. For Popular, Inc., a sustained decline in operating cash flow relative to net income would signal that the negative narrative is beginning to manifest in the business itself. For the cash-burning holdings, a stabilization of free cash flow toward neutral levels would suggest that the upbeat narratives are finally being supported by operational reality.
Macroeconomic conditions and institutional views
On the macroeconomic front, broader indicators suggest a mixed environment for US equities, which form the core of your portfolio. Consumer sentiment was measured at 51.7 as of August 1, down 3.5 from the previous reading. In a research note published on September 28, 2026, Goldman Sachs stated that this decline reflects a structural shift in consumer confidence rather than a temporary fluctuation. If this depressed sentiment holds, the mechanical consequence is a contraction in consumer credit expansion, which reduces the velocity of money in the retail sector. This reading would change if upcoming retail sales figures show a sustained increase above the current rate of inflation, indicating that consumer behavior has decoupled from sentiment surveys.
This decline in sentiment occurred alongside a slight rise in inflation expectations, which reached 2.35% as of September 29, up 0.01% from the previous reading. At the same time, the broader economy showed some resilience, with non-farm payrolls at 159.1 million as of August 1, up 162,000 from the previous reading, and the unemployment rate holding at 4.1%. Retail sales also rose by $8.2 billion to reach $646.3 billion. These mixed signals mean that the domestic market is operating under heightened uncertainty, making the rigorous comparison of earnings to cash flow even more critical for capital preservation.
| Symbol | Change over 23-29 Sep 2026 | Versus the S&P 500 |
|---|---|---|
| BPOP | -7.1% | -6.7 pts |
| BTDR | +0.5% | +0.8 pts |
| LCID | -16.1% | -15.7 pts |
| QURE | -49.7% | -49.3 pts |
Questions readers ask
What did the gap between market narrative and actual numbers look like for LCID?
For LCID, the gap between upbeat coverage and softening numbers held all week at -2.1 standard deviations apart. As of September 30, 2026, the company had a free cash flow of $-6.6 billion, earnings per share of $-10.68, and a price to earnings ratio of -0.30, meaning risk was building quietly while the story still read well.
How did the financial numbers for BTDR compare to its market coverage?
For BTDR, the coverage stayed upbeat while the numbers softened, leaving a gap that held all week at -2.1 standard deviations apart. On September 30, 2026, the company had a free cash flow of $-2.1 billion, earnings per share of $-1.82, and a price to earnings ratio of -5.40.
Why is BPOP described as a case where it is worth knowing the facts before acting on headlines?
For BPOP, media coverage turned negative while its actual numbers held up, leaving a gap of +2.3 standard deviations that held all week. On September 30, 2026, the company recorded a positive free cash flow of $807.2 million, earnings per share of $15.17, and a dividend yield of 2.02%.
What do the latest measurements show about the state of the US economy?
On August 1, 2026, US consumer sentiment fell by 3.5 to 51.7, retail sales rose by $8.2 billion to $646.3 billion, and the unemployment rate was 4.1%. On September 29, 2026, inflation expectations rose by 0.01% to reach 2.35%.